Diagnosability – logging, metrics, and tracing
In this section, we're going to take a look at adding request-and-response logging using the Jersey logging feature. We'll have a look at using MicroProfile 1.2 APIs to add metrics and health endpoints. Finally, we'll see how we can include tracing with the OpenTracing API and Jaeger.
Before we start, let's have a quick look at the diagnosability triangle. Diagnosability is really important when it comes to developing web services and distributed applications. When people talk about metrics, you might have heard of Prometheus; when it comes to logging, maybe you've heard about Fluentd; and for tracing, OpenTracing is the most state-of-the-art API out there. Make sure you have a look at these technologies and their stacks.
Let's explore the diagnosability triangle for a small web service:
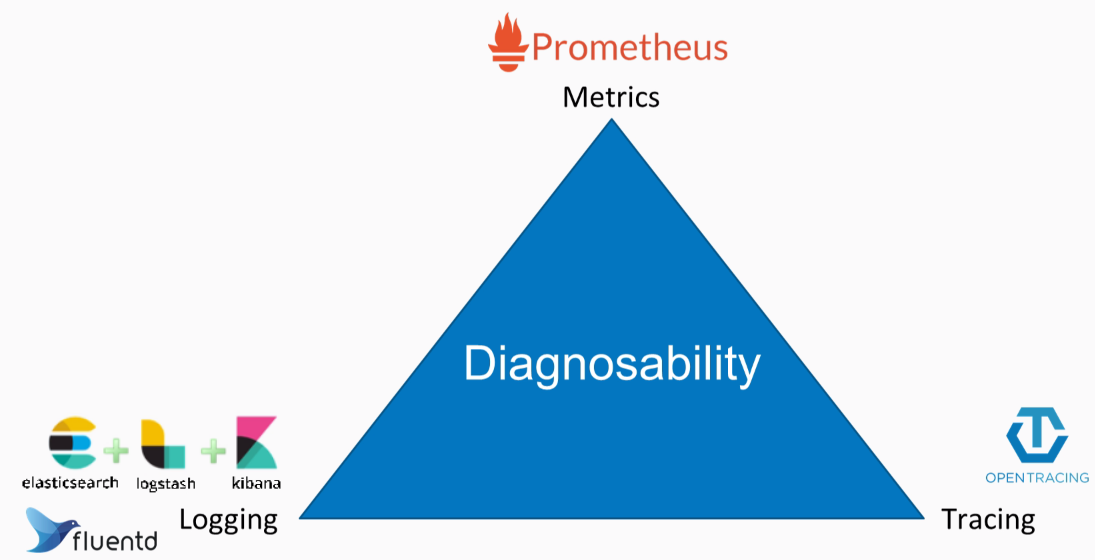
The diagnosability triangle
Let's open the IDE to get started. Open the POM file and add a few dependencies. The first dependency we want to enable is the jersey...