Handling NA values
Sometimes, it is acceptable to have NA values in the dataset. However, for many types of analysis, NA values need to be either removed or replaced. In the case of road length, a better estimate of total road length could be generated if the NA values were replaced with best guesses. In the following subsections, I will walk through these three approaches to handling NA values:
- Deletion
- Insertion
- Imputation
Deleting missing values
The simplest way to handle NA values is to delete any entry that contains an NA value, or a certain number of NA values. When removing entries with NA values, there is a trade-off between the correctness of the data and the completeness of the data. Data entries that contain NA values may also contain several useful non-NA values, and and removing too many data entries could reduce the dataset to a point where it is no longer useful.
For this dataset, it is not that important to have all of the years present; even one year is enough to give us a rough idea of how much road length is in the particular region at any point over the 12 years. A safe approach for this particular application would be to remove all of the rows where all of the values are NA.
A quick shortcut to finding the rows for which all values are NA is to use the rowSums() function. The rowSums() function finds the sum of each row, and takes a parameter to ignore NA values. The following finds the sum of the non-NA values in the roads.num2 dataframe:
roads.num2.rowsums <- rowSums(roads.num2,na.rm=TRUE)
Because NA values are ignored, in the resulting vector of row sums, a 0 corresponds to either a row with all NA values or a region with no roads. In either case, a 0 value corresponds to a row that is not important and can be filtered out. The following creates an index that can be used to filter out all such rows:
roads.keep3 <- roads.num2.rowsums > 0
In the following continuation of r_intro.R, the roads.keep3 vector is used to filter out the rows that have either all NA values or 0 roads:
roads3 <- roads2[roads.keep2,]
roads.num3 <- roads.num2[roads.keep2,]
roads.means3 <- roads.means3
Next, I will do a quick demonstration of another approach to NA handling, replacing the values with a constant.
Replacing missing values with a constant
Replacing all NA values with a constant is actually rather simple. A dataframe can be indexed using another dataframe of logical values of the same dimension. The following will create a new dataframe that is a copy of roads3 and replace all of the NA values with 0:
roads.replace.na <- roads3
roads.replace.na[is.na(roads3)] <- 0
In this chapter, I won't use the dataframe with replaced NA values which was just created, so this is just for demonstration purposes. A more effective way to handle NA values, when possible, is to replace the missing value with an estimate based on existing data.
Imputation of missing values
A good guess for the missing values is the mean value of the non-NA values in the same row (in a particular region), since the total length of road doesn't change all that much year to year.
In the following continuation of r_intro.R, the row means in indices corresponding to NA values in 2011 are extracted from the roads.means3 vector. The extracted row means are then assigned to the indices of the roads.2011.3 vector which correspond to NA values:
roads.2011.3 <- roads3$X2011
roads.2011.3[is.na(roads.2011.3)] <- roads.means3[is.na(roads.2011.3)]
print(sum(roads.2011.3))
This results in a much better estimate of the total roads length as of 2011. It is possible to go even further however to get a similar estimate for each column.
There are a number of ways to approach the task of getting an estimate for each column. The approach I will take is to go column by column and replace each of the NA values in that column with the corresponding mean value for the corresponding row.
This can be done with the apply() function, which applies a function to each column. Before using the apply()function, you will need to create the function that is applied to each column. Functions in R work similarly to functions in Python, but have a different syntax. The following is the syntax for a function in R:
my.function <- function(<arguments>){
    <code block>
    return(result)
}
The following is a function called impute() which takes two arguments: a vector that is a column of a dataframe, and a vector of equal length that contains the imputation values for each row. The impute function returns the original dataframe column where the NA values have been replaced with the corresponding imputation values:
impute <- function(x,imputations) {
    x[is.na(x)] <- imputations[is.na(x)]
    return(x)
}
The apply() function takes as its first argument a dataframe, and its third argument a function. The second argument to the apply() function is a 1 if the function should be applied to each row, or a 2 if the function should be applied to each column. After the third argument, all additional arguments to the apply() function are passed into the function which is specified in the third argument. The apply() function returns a data type called a matrix, so the result will need to be converted back to a dataframe using the data.frame() function.
In the following continuation of r_intro.R the apply() function is used to go column by column, run the impute function on each column, and return a result with the imputed values:
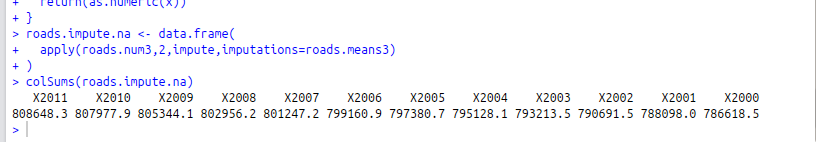
## apply the impute function to each column with apply()
roads.impute.na <- data.frame(
 apply(roads3,2,impute,imputations=roads.means3)
)
print(colSums(roads.impute.na))
The resulting dataframe--roads.impute.na--is now a dataframe containing imputed values in the place of the NA values. Printing the column sums with the colSums() function should reveal the estimated total road length for each year in the console output: