Search icon CANCEL
Subscription
0
Cart icon
Your Cart (0 item)
Close icon
You have no products in your basket yet
Save more on your purchases! discount-offer-chevron-icon
Savings automatically calculated. No voucher code required.
Arrow left icon
All Products
Best Sellers
New Releases
Books
Videos
Audiobooks
Learning Hub
Newsletter Hub
Free Learning
Arrow right icon
timer SALE ENDS IN
0 Days
:
00 Hours
:
00 Minutes
:
00 Seconds
Arrow up icon
GO TO TOP
Mastering Python Data Visualization

You're reading from   Mastering Python Data Visualization Generate effective results in a variety of visually appealing charts using the plotting packages in Python

Arrow left icon
Product type Paperback
Published in Oct 2015
Publisher
ISBN-13 9781783988327
Length 372 pages
Edition 1st Edition
Languages
Arrow right icon
Author (1):
Arrow left icon
Kirthi Raman Kirthi Raman
Author Profile Icon Kirthi Raman
Kirthi Raman
Arrow right icon
View More author details
Toc

Table of Contents (16) Chapters Close

Mastering Python Data Visualization
Credits
About the Author
About the Reviewers
www.PacktPub.com
Preface
1. A Conceptual Framework for Data Visualization FREE CHAPTER 2. Data Analysis and Visualization 3. Getting Started with the Python IDE 4. Numerical Computing and Interactive Plotting 5. Financial and Statistical Models 6. Statistical and Machine Learning 7. Bioinformatics, Genetics, and Network Models 8. Advanced Visualization Go Forth and Explore Visualization Index

The Bayes theorem


In order to understand the Bayes theorem first, before we attempt to take a look at the Naïve Bayes classification method, we should consider this example. Let's assume that among all the people in the U universe, the set of people who have breast cancer is set A, and set B is the set of people who had a screening test and were unfortunately diagnosed with the result positive for breast cancer. This is shown as the overlap region A∩B in the following diagram:

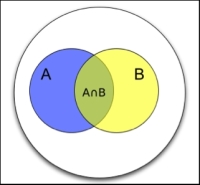
There are two unusual areas that need focus: B – A∩B or people without breast cancer and with a positive test on diagnosis and the event A – A∩B or people with breast cancer and with a negative test on diagnosis. Now, let's attempt to answer whether we know that the test is positive for a randomly selected person. Then, what is the probability that the person has breast cancer? This visually translates to whether we know that a person is visible in the B area, then what is the probability that the same person appears...

lock icon The rest of the chapter is locked
Register for a free Packt account to unlock a world of extra content!
A free Packt account unlocks extra newsletters, articles, discounted offers, and much more. Start advancing your knowledge today.
Unlock this book and the full library FREE for 7 days
Get unlimited access to 7000+ expert-authored eBooks and videos courses covering every tech area you can think of
Renews at AU $19.99/month. Cancel anytime
Visually different images