Search icon CANCEL
Subscription
0
Cart icon
Your Cart (0 item)
Close icon
You have no products in your basket yet
Save more on your purchases! discount-offer-chevron-icon
Savings automatically calculated. No voucher code required.
Arrow left icon
All Products
Best Sellers
New Releases
Books
Videos
Audiobooks
Learning Hub
Newsletter Hub
Free Learning
Arrow right icon
timer SALE ENDS IN
0 Days
:
00 Hours
:
00 Minutes
:
00 Seconds
Arrow up icon
GO TO TOP
Web Application Development with R Using Shiny Second Edition

You're reading from   Web Application Development with R Using Shiny Second Edition Integrate the power of R with the simplicity of Shiny to deliver cutting-edge analytics over the Web

Arrow left icon
Product type Paperback
Published in Jan 2016
Publisher Packt
ISBN-13 9781782174349
Length 194 pages
Edition 2nd Edition
Languages
Tools
Arrow right icon
Author (1):
Arrow left icon
Chris Beeley Chris Beeley
Author Profile Icon Chris Beeley
Chris Beeley
Arrow right icon
View More author details
Toc

Table of Contents (14) Chapters Close

Web Application Development with R Using Shiny Second Edition
Credits
About the Author
About the Reviewer
www.PacktPub.com
Preface
1. Getting Started with R and Shiny! FREE CHAPTER 2. Building Your First Application 3. Building Your Own Web Pages with Shiny 4. Taking Control of Reactivity, Inputs, and Outputs 5. Advanced Applications I – Dashboards 6. Advanced Applications II – Using JavaScript Libraries in Shiny Applications 7. Sharing Your Creations Index

Dygraphs


The dygraphs library in JavaScript (http://dygraphs.com/) is designed to show the time series and trend data. It supports zoom, pan, mouseover, and even supports mobile devices by offering pinch to zoom. The dygraphs R package provides a handy interface to many of the functions of the dygraphs library. It can be installed using install.packages("dygraphs").

We'll take a look at a few of the things that can be done with the package here. Let's take a look at the finished graph:

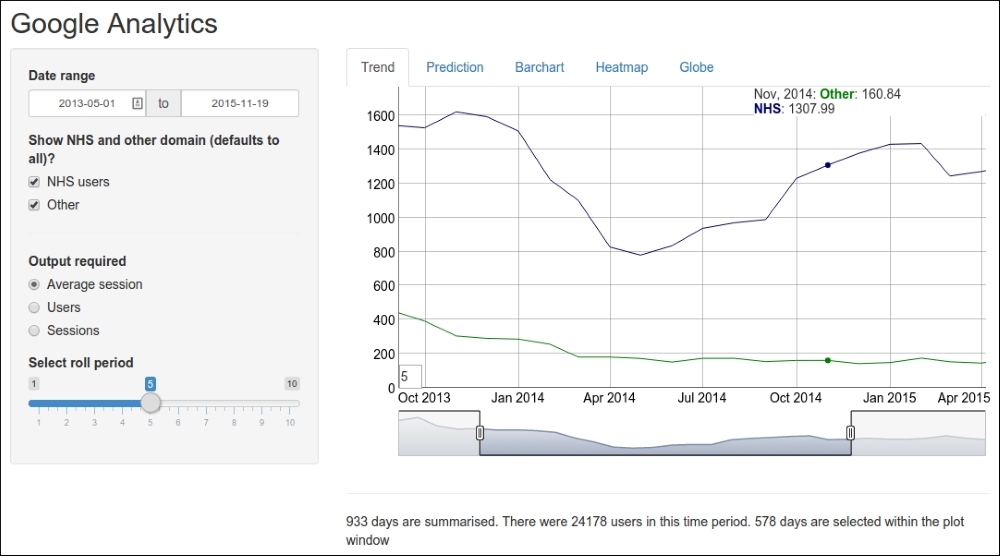
There are a couple of things you need to make a note of on this graph. Firstly, you can see the mouseover effect at the top-right of the graph, where the date and values of NHS and Other are listed. Secondly, this graph has been smoothed using a rolling average. The number of points to be averaged is specified in the widget on the left-hand side of the page (Select roll period) and is given by default in the small square box at the bottom-left of the graph. Thirdly, the grey box at the bottom with the selector...

lock icon The rest of the chapter is locked
Register for a free Packt account to unlock a world of extra content!
A free Packt account unlocks extra newsletters, articles, discounted offers, and much more. Start advancing your knowledge today.
Unlock this book and the full library FREE for 7 days
Get unlimited access to 7000+ expert-authored eBooks and videos courses covering every tech area you can think of
Renews at $15.99/month. Cancel anytime
Visually different images