Search icon CANCEL
Subscription
0
Cart icon
Your Cart (0 item)
Close icon
You have no products in your basket yet
Save more on your purchases! discount-offer-chevron-icon
Savings automatically calculated. No voucher code required.
Arrow left icon
All Products
Best Sellers
New Releases
Books
Videos
Audiobooks
Learning Hub
Newsletter Hub
Free Learning
Arrow right icon
timer SALE ENDS IN
0 Days
:
00 Hours
:
00 Minutes
:
00 Seconds
Arrow up icon
GO TO TOP
VMware vSphere Troubleshooting

You're reading from   VMware vSphere Troubleshooting Gain expertise in troubleshooting most common issues to implement vSphere environments with ease

Arrow left icon
Product type Paperback
Published in Nov 2015
Publisher
ISBN-13 9781783551767
Length 270 pages
Edition 1st Edition
Tools
Arrow right icon
Author (1):
Arrow left icon
 Zeeshan Munir Zeeshan Munir
Author Profile Icon Zeeshan Munir
Zeeshan Munir
Arrow right icon
View More author details
Toc

Table of Contents (16) Chapters Close

VMware vSphere Troubleshooting
Credits
About the Author
About the Reviewers
www.PacktPub.com
Preface
1. The Methodology of Problem Solving FREE CHAPTER 2. Monitoring and Troubleshooting Host and VM Performance 3. Troubleshooting Clusters 4. Monitoring and Troubleshooting Networking 5. Monitoring and Troubleshooting Storage 6. Advanced Troubleshooting of vCenter Server and vSphere Hosts Learning PowerGUI Basics Installing VMware vRealize Operations Manager Power CLI - A Basic Reference Index

vCenter performance charts


VMware provides another great tool to monitor and troubleshoot vSphere host performance using its charts. These charts can be very helpful and offer user-friendly ways to diagnose vSphere host problems. You can easily create new charts, customize metrics, customize the time, and save the settings. Alternatively, VMware has provided built-in general purpose options for the charts to use the existing settings. The chart does not only offer real-time monitoring but also presents information about the past day, week, month, or year. In this section, we will go through the following topics briefly:

  • Creating charts

  • Configuring metrics

  • Configuring logging level for performance
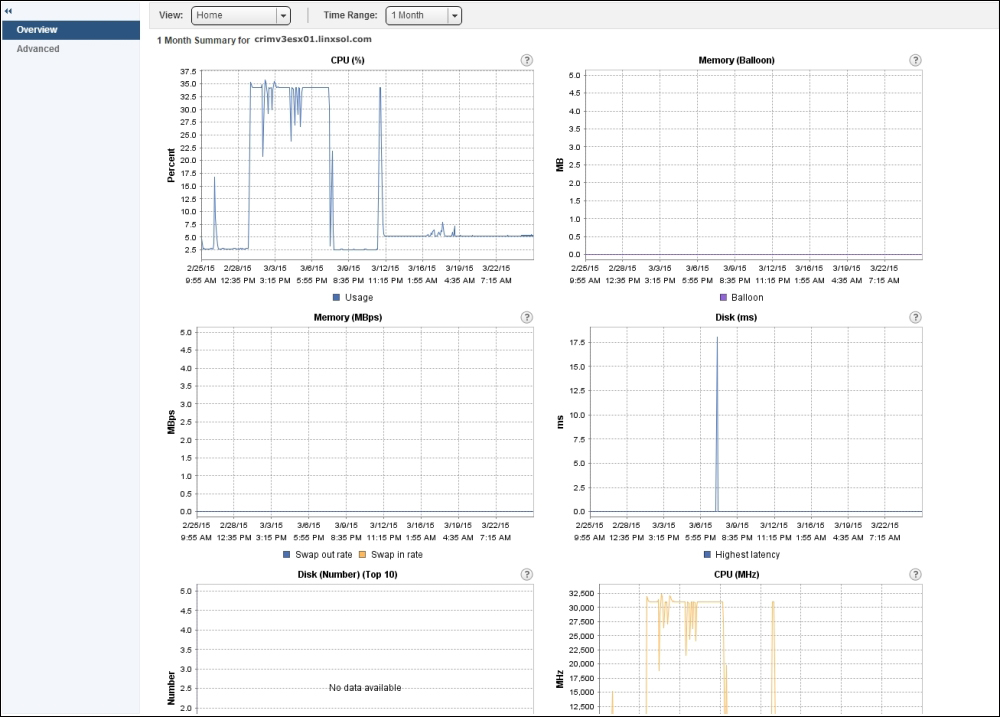
Figure 2.13

You can choose two options when viewing the charts: Overview and Advanced. As you can see in the preceding figure, both options can be found in the left column. You can find some of the most common preconfigured metrics in the Overview chart, for example CPU usage, memory ballooning, memory...

lock icon The rest of the chapter is locked
Register for a free Packt account to unlock a world of extra content!
A free Packt account unlocks extra newsletters, articles, discounted offers, and much more. Start advancing your knowledge today.
Unlock this book and the full library FREE for 7 days
Get unlimited access to 7000+ expert-authored eBooks and videos courses covering every tech area you can think of
Renews at $15.99/month. Cancel anytime
Visually different images