Installing Splunk on Linux
If you choose to install Splunk on a Linux machine, these are the instructions you need to follow. Take your time and do not rush the installation. For this Linux installation, the steps assume you will run Splunk in your user profile's home directory:
- Decompress the
.tgzfile you downloaded. The result of the decompression is asplunkfolder and all the related Splunk files contained inside. - Change the working directory to
$SPLUNK_HOME/bin. - Run the following command to start Splunk for the first time:
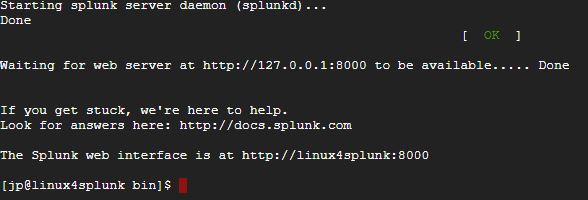
./splunk start
- Accept the Splunk license when prompted.
- Splunk will start successfully and the end results should appear like this:
Note
Tip from the Fez: In most organizational environments, it is common to install Splunk in /opt/. When installing on Linux, it is best practice to adjust the ulimit settings and disable transparent hugh page functionality for Splunk applications that will be loading data in real time, supporting a community of users.
Note
Tip from the Fez: Unlike Windows installations, Splunk Linux installations aren't automatically configured to start upon reboot of the Splunk server. Ensure that you configure your Splunk instance on Linux for what is known as boot start so that if the Linux instance is restarted, Splunk will automatically restart with the operating system.
Note
Tip from the Fez: In an enterprise environment, create a Linux user specifically for running Splunk and use that. Do not run Splunk as the Linux root user or an individuals user.
Logging in for the first time
Launch the application for the first time in your default browser. You can also manually access the Splunk web page via the http://localhost:8000 URL if you have installed locally. If using a cloud instance, use http://ipaddress:8000 since you are connecting via a traditional internet connection as opposed to locally.
Note
Splunk requires you to use a modern browser. It supports most versions of Google Chrome, Firefox, and newer versions of Internet Explorer. It may not support older versions of Internet Explorer.
Log in with the default username as admin and password as changeme, as indicated in the following screenshot:
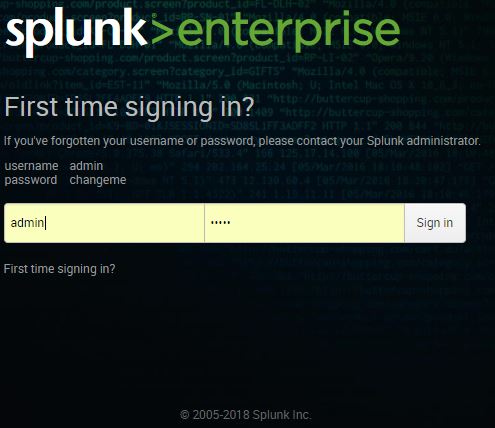
The next step is to change the default administrator password, while keeping the default username. Do not skip this step. Make security an integral part of your day-to-day routine. Choose a password that will be secure.
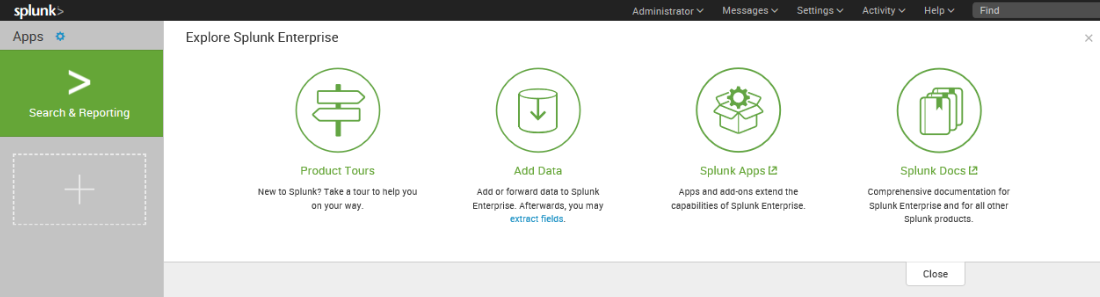
Assuming that all goes well, you will now see the default Splunk Enterprise landing page as follows:
Running a simple search
You are ready to run your first Splunk search:
- Click directly on the green
Search & Reportingapp button. In this example, you use Splunk's very own internal index; this is Splunk's way of splunking itself (or collecting detailed information on all its underlying processes).
Note
An index is the term given to where Splunk stores event data captured from log files, APIs, HTTP events, delimited files, and other machine data sources. It is in some ways like a database, but should not be compared to traditional relational databases in functionality or performance.
- In the
New Searchinput, type in the following search query (more about the Search Processing Language (SPL) in Chapter 3, Search Processing Language):
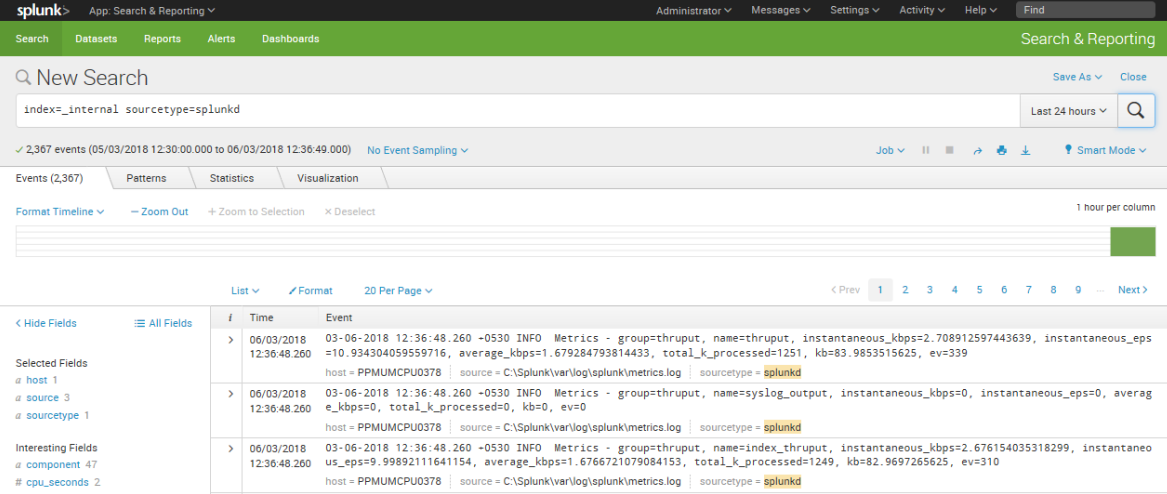
SPL> index=_internal sourcetype=splunkdNote
TheSPL>prefix will be used as a convention in this book to indicate a SplunkSearchcommand. Since SPL is submitted via the Splunk user interface, there is no difference whether operating in Windows or Linux environments. The underscore before the index name_internalmeans that it is a system index internally used by Splunk. Omitting the underscore will not yield any result, as internal is not a default index.
- This search query will have as an output the raw events from the
metrics.logfile that is stored in the_internalindex. A log file keeps track of every event that takes place in the system. The_internalindex keeps track of every event that occurs and makes it easily accessible.
- Take a look at these raw events, as shown in the following screenshot. You will see fields listed on the left side of the screen. The important
Selected Fieldsarehost,source, andsourcetype. We will go into more detail about these later, but suffice to say that you will frequently search on one of these, as we have done here. As you can see from the highlighted fields, we indicated that we were looking for events wheresourcetype=splunkd. UnderneathSelected Fields, you will seeInteresting Fields. As you can tell, the purposes of many of these fields are easy to guess as seen in the following screenshot: