Creating your first dashboard
Now that we have data in Splunk, it's time to use it in order to derive something meaningful out of it. You are still in the Destinations app, correct? We will show you the basic routine when creating new dashboards and dashboard panels.
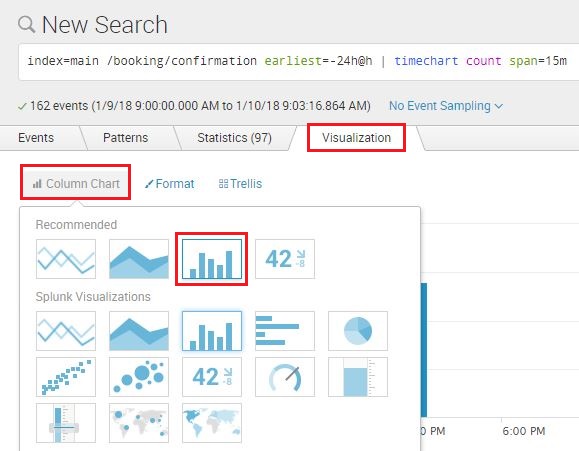
Type in or copy/paste the following search query in the Search Field, then hit Enter:
SPL> index=main /booking/confirmation earliest=-24h@h | timechart
     count span=15m
After the search results render, click on the Visualization tab. This will switch your view into a visualization so you can readily see how your data will look. By default, it should already be using the Column Chart as shown in the following screenshot. If it does not, then use the screenshot as a guide on how to set it:
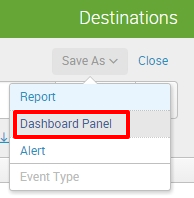
Now that you can see your Column Chart, it is time to save it as a dashboard. Click on Save As in the upper-right corner of the page, then select Dashboard Panel, as shown in the following screenshot:
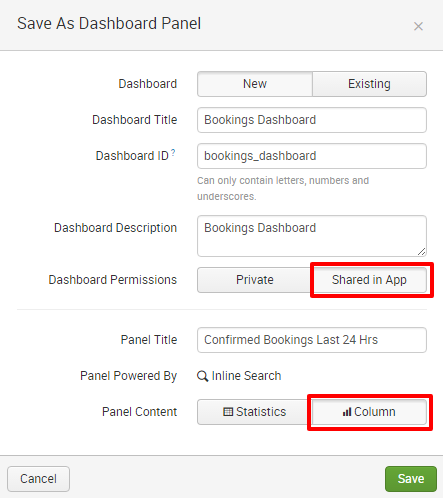
Now, let's fill up that dashboard panel information, as seen in the following screenshot. Make sure to select the Shared in App in the Dashboard Permissions section:
Finish up by clicking View Dashboard in the next prompt:
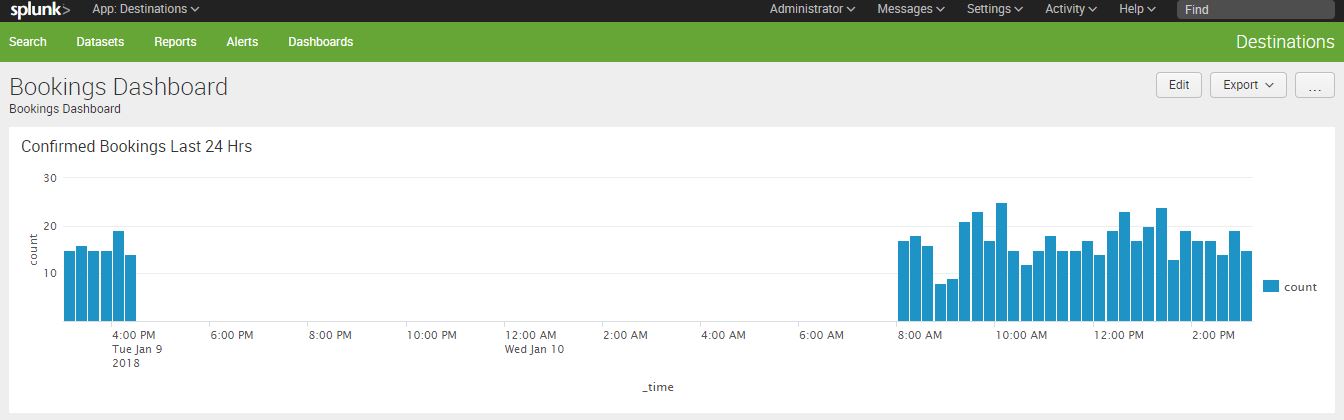
You have created your very first Splunk dashboard with a single panel telling you the number of confirmed bookings in the last 24 hours at 15-minute intervals. If you let Eventgen run for a while and rerun the dashboard, the contents will populate as the data is generated. Time to show it to your boss!
In one chapter we acquired, installed, and used Splunk. We now have a fully-functional Splunk installation with live data. Leave Splunk running for two hours or so. After a few hours, you can stop Splunk if you need to rest for a bit to suppress indexing and restart it when you're ready to proceed into the next chapters.
Do you recall how to control Splunk from the command line?
Windows:   C:Splunkbin> splunk stopC:Splunkbin> splunk start
             C:Splunkbin> splunk restart
Linux:       bin]$ ./splunk stop
             bin]$ ./splunk start
             bin]$ ./splunk restart