
Static real-time dashboard
In this section, we will create a real-time dashboard that will display crucial information based on the data we have. To encourage you, we present a screenshot here and show how it will look when we are done:
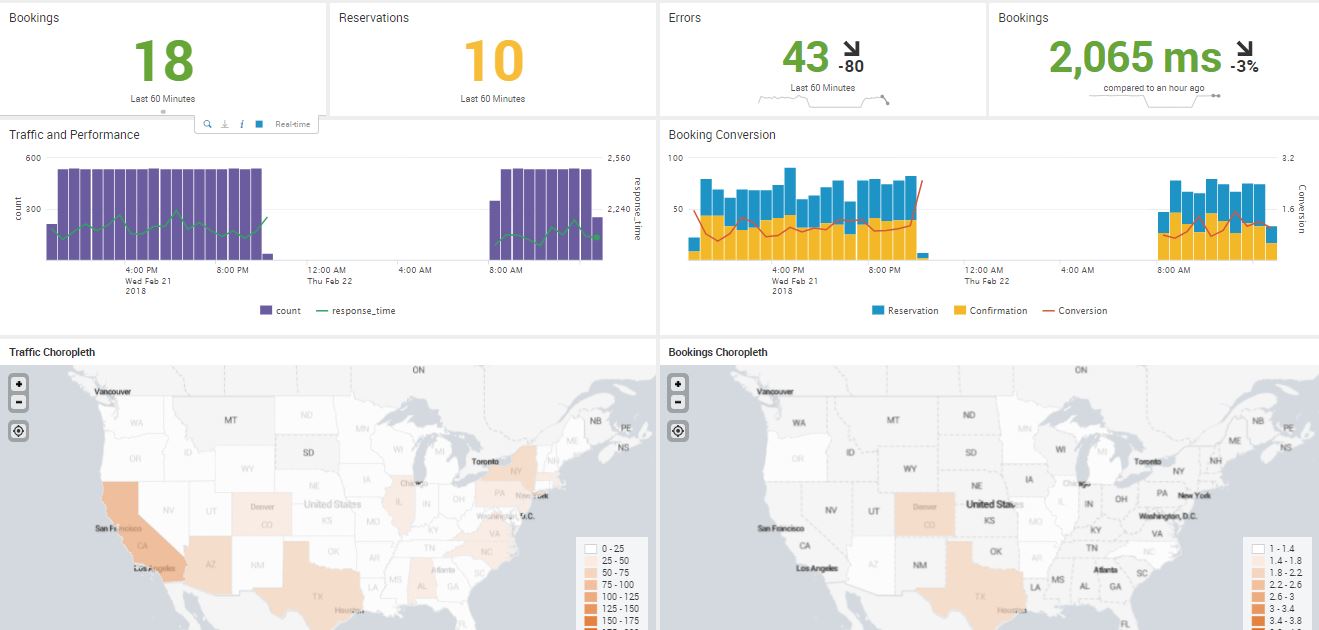
Test real-time dashboard with advanced indicators, combo charts, and choropleth charts
Single-value panels with color ranges
In the previous sections, you first created panels by running searches and then saving them as dashboard panels. You then started to modify the visualization in each panel. This is one way to build a dashboard. However, you may first want to see the visualization before adding it to a dashboard. We will use that method in this real-time dashboard exercise:
- Let's start with a search command in the
Destinationsapp to begin creating the dashboard:
SPL> index=main http_uri=/booking/confirmation http_status_code=200
| stats count- Select
Real-Time|1 hour windowin theTime Rangepreset and run the search. - Click on the
Visualizationtab...