
Data displays employing different kinds of visual representation
In the following section, we will cover different ways of displaying data employing different kinds of visual representation.
Getting ready
Let's begin our introduction with a look at the anatomy of a Matplotlib plot, in the following figure:
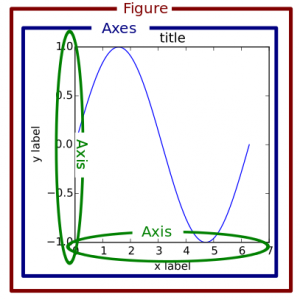
Matplotlib uses a hierarchy of objects to display all of its plotting items in the output. This hierarchy is key to understanding everything about Matplotlib. The Figure and Axes objects are the two main components of the hierarchy. The Figure object is at the top of the hierarchy. It is the container for everything that will be plotted. Contained within the Figure is one or more Axes object(s). The Axes is the primary object that you will interact with when using Matplotlib and can be more commonly thought of as the actual plotting surface. The Axes contains the x ory axis, points, lines, markers, labels, legends, and any other useful item that is plotted.
How to do it...
One of the most common...