Search icon CANCEL
Subscription
0
Cart icon
Your Cart (0 item)
Close icon
You have no products in your basket yet
Save more on your purchases! discount-offer-chevron-icon
Savings automatically calculated. No voucher code required.
Arrow left icon
All Products
Best Sellers
New Releases
Books
Videos
Audiobooks
Learning Hub
Newsletter Hub
Free Learning
Arrow right icon
timer SALE ENDS IN
0 Days
:
00 Hours
:
00 Minutes
:
00 Seconds
Arrow up icon
GO TO TOP
Qlik Sense Cookbook

You're reading from   Qlik Sense Cookbook Over 80 recipes on data analytics to solve business intelligence challenges

Arrow left icon
Product type Paperback
Published in Aug 2018
Publisher Packt
ISBN-13 9781788997058
Length 334 pages
Edition 2nd Edition
Arrow right icon
Authors (3):
Arrow left icon
 Labbe Labbe
Author Profile Icon Labbe
Labbe
 Hand Hand
Author Profile Icon Hand
Hand
 Kharpate Kharpate
Author Profile Icon Kharpate
Kharpate
Arrow right icon
View More author details
Toc

Table of Contents (16) Chapters Close

Title Page
Copyright and Credits
Packt Upsell
Contributors
Preface
1. Getting Started with the Data FREE CHAPTER 2. Visualizations 3. Scripting 4. Managing Apps and the User Interface 5. Useful Functions 6. Set Analysis 7. Using Extensions in Qlik Sense 8. Advanced Aggregation with AGGR 9. Tips and Tricks 1. Other Books You May Enjoy Index

Using the visual exploration menu


You can use the visual exploration menu to change some properties without editing the sheet. For example, you can change dimension order, change to an alternative dimension or measure, sort data, change coloring by dimension or measure, and change how labels are displayed.

Getting ready

For this recipe, we will reuse the charts used in the Creating treemaps recipe and the bar chart from the Using alternative dimensions and measures recipe.

How to do it…

  1. If you are in edit mode, click onDone.
  2. Hover your mouse over the Treemap object.
  3. Click the Sliders button at the top-right of the visualization, or right-click on the visualization and select Open Exploration menu.
  1. Open the Presentation section and set on in the Value labels property.
  2. The result should resemble the following screenshot:
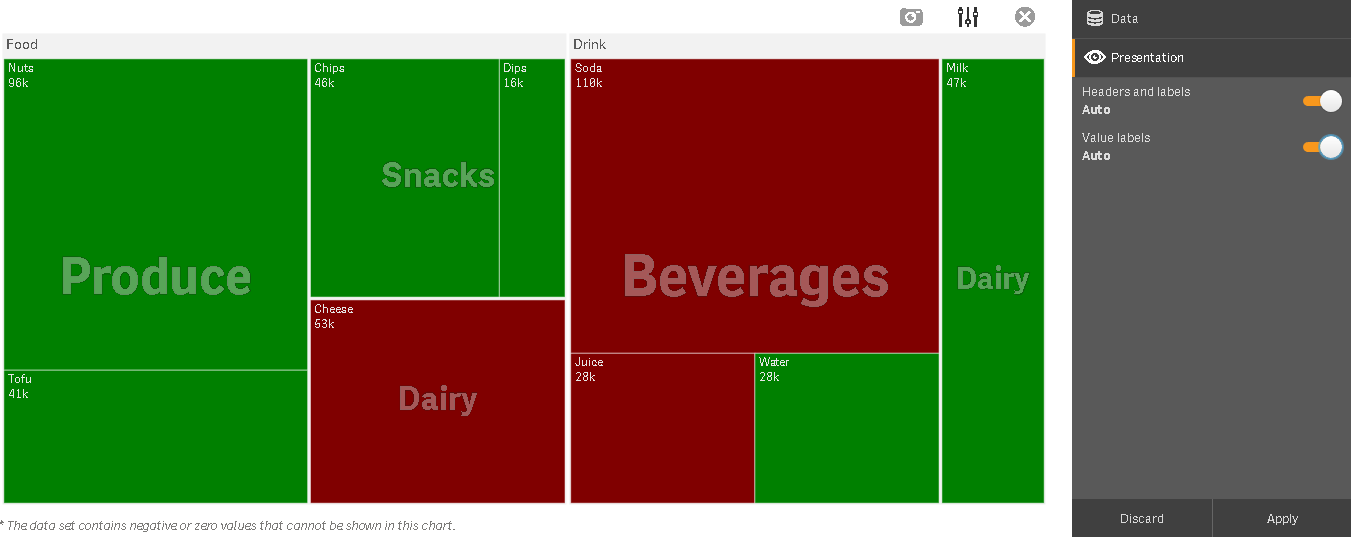
  1. The value labels are shown on each block.
  2. Click on Close full screen to close the menu and go back to visualization mode.
  3. Now, go to the sheet with the bar chart created in the last...
lock icon The rest of the chapter is locked
Register for a free Packt account to unlock a world of extra content!
A free Packt account unlocks extra newsletters, articles, discounted offers, and much more. Start advancing your knowledge today.
Unlock this book and the full library FREE for 7 days
Get unlimited access to 7000+ expert-authored eBooks and videos courses covering every tech area you can think of
Renews at $15.99/month. Cancel anytime
Visually different images