


Formatting reports for publication
Power BI Desktop includes to control and enhance the formatting and layout of reports at a detailed level. Prior to publishing reports to the Power BI Service, visuals can be aligned, sized, and evenly spaced to deliver an organized, symmetrical layout. Additionally, supplemental report elements such as shapes, textboxes, and images can be added to further organize and enrich report pages with textual and visual aids.
This recipe how to control the positioning, alignment, and distribution of report visuals. An additional example is provided of using a Shape as a background color and border for a group of visuals. Further formatting techniques and examples, including embedding URLs in textboxes, are provided in the There's more... section.
How to do it...
Visual alignment and distribution
- Identify the visuals to align.
- In this example, three on the right side of a page need to be aligned and distributed.
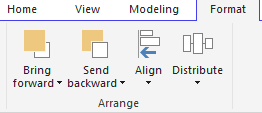
Align and distribute dropdowns in Report View
- Additionally...


