


The secant method
The secant method uses secant lines to find the root. A secant line is a straight line that intersects two points of a curve. In the secant method, a line is drawn between two points on the continuous function such that it extends and intersects the  axis. This method can be thought of as a Quasi-Newton method. By successively drawing such secant lines, the root of the function can be approximated.
The secant method is graphically represented in the following screenshot. An initial guess of the two axis values  and
and  is required to find
  and
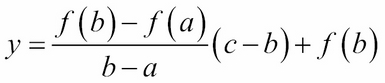
and  . A secant line y is drawn from to and intersects at point
  on the axis such that:
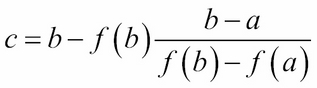
The solution to is therefore:
On the next iteration, and will take on the values of and respectively. The method repeats itself, drawing secant lines for the axis values of and , and , and  , and so on. The solution terminates when the maximum number of iterations has been reached or the difference between and has reached a prespecified tolerance...


