Search icon CANCEL
Subscription
0
Cart icon
Your Cart (0 item)
Close icon
You have no products in your basket yet
Save more on your purchases! discount-offer-chevron-icon
Savings automatically calculated. No voucher code required.
Arrow left icon
All Products
Best Sellers
New Releases
Books
Videos
Audiobooks
Learning Hub
Newsletter Hub
Free Learning
Arrow right icon
timer SALE ENDS IN
0 Days
:
00 Hours
:
00 Minutes
:
00 Seconds
Arrow up icon
GO TO TOP
Mastering D3.js

You're reading from   Mastering D3.js Bring your data to life by creating and deploying complex data visualizations with D3.js

Arrow left icon
Product type Paperback
Published in Aug 2014
Publisher Packt
ISBN-13 9781783286270
Length 352 pages
Edition 1st Edition
Tools
Arrow right icon
Author (1):
Arrow left icon
Pablo NAVARRO CASTILLO Pablo NAVARRO CASTILLO
Author Profile Icon Pablo NAVARRO CASTILLO
Pablo NAVARRO CASTILLO
Arrow right icon
View More author details
Toc

Table of Contents (19) Chapters Close

Mastering D3.js
Credits
About the Author
About the Reviewers
www.PacktPub.com
Preface
1. Data Visualization FREE CHAPTER 2. Reusable Charts 3. Creating Visualizations without SVG 4. Creating a Color Picker with D3 5. Creating User Interface Elements 6. Interaction between Charts 7. Creating a Charting Package 8. Data-driven Applications 9. Creating a Dashboard 10. Creating Maps 11. Creating Advanced Maps 12. Creating a Real-time Application Index

Chapter 10. Creating Maps

Maps are a 2D representation of the relevant features of places. Which features are relevant will depend on the purpose of the map; a map for a zoo will show the entrances, thematic areas, gift store, and where each animal is. In this case, there is no need for the sizes and distances to be precise. In a geologic map, we will need accurate distances and representations of the rock units and geologic strata.

Positions on the surface of the earth are described by two coordinates, longitude and latitude. The longitude of a point is the angle between the point and the Greenwich meridian, and the latitude is the angle between the point and the equator. The latitude and longitude are the angles measured with respect to the equator and the Greenwich meridian, as shown in the following diagram:

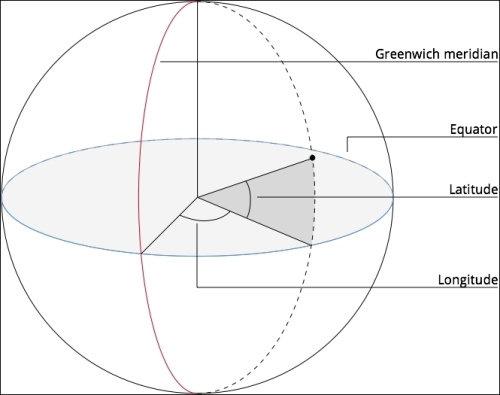
The longitude can take values between -180 and 180, while the latitude can have values between 90 (the North Pole) and -90 (the South Pole).

Shapes on the earth can be described by...

lock icon The rest of the chapter is locked
Register for a free Packt account to unlock a world of extra content!
A free Packt account unlocks extra newsletters, articles, discounted offers, and much more. Start advancing your knowledge today.
Unlock this book and the full library FREE for 7 days
Get unlimited access to 7000+ expert-authored eBooks and videos courses covering every tech area you can think of
Renews at $15.99/month. Cancel anytime
Visually different images