Search icon CANCEL
Subscription
0
Cart icon
Your Cart (0 item)
Close icon
You have no products in your basket yet
Save more on your purchases! discount-offer-chevron-icon
Savings automatically calculated. No voucher code required.
Arrow left icon
All Products
Best Sellers
New Releases
Books
Videos
Audiobooks
Learning Hub
Newsletter Hub
Free Learning
Arrow right icon
timer SALE ENDS IN
0 Days
:
00 Hours
:
00 Minutes
:
00 Seconds
Arrow up icon
GO TO TOP
Learning Tableau 10

You're reading from   Learning Tableau 10 Business Intelligence and data visualization that brings your business into focus

Arrow left icon
Product type Paperback
Published in Sep 2016
Publisher Packt
ISBN-13 9781786466358
Length 432 pages
Edition 2nd Edition
Languages
Tools
Arrow right icon
Toc

Table of Contents (17) Chapters Close

Learning Tableau 10 Second Edition
Credits
About the Author
About the Reviewers
www.PacktPub.com
Preface
1. Creating Your First Visualizations and Dashboard FREE CHAPTER 2. Working with Data in Tableau 3. Moving from Foundational to More Advanced Visualizations 4. Using Row-Level, Aggregate, and Level of Detail Calculations 5. Table Calculations 6. Formatting a Visualization to Look Great and Work Well 7. Telling a Data Story with Dashboards 8. Deeper Analysis – Trends, Clustering, Distributions, and Forecasting 9. Making Data Work for You 10. Advanced Visualizations, Techniques, Tips, and Tricks 11. Sharing Your Data Story

Trending


World Population.xlsx is included in the Chapter 08 directory. It contains one record for each country for each year from 1960 to 2015, measuring population. Using this data set, let's take a look at the historical trends of various countries. Create a view similar to the following, which shows the change in population over time for Afghanistan and Australia. You'll notice that Country Name has been filtered to include only Afghanistan and Australia and the field has additionally been added to the Color and Label shelves:

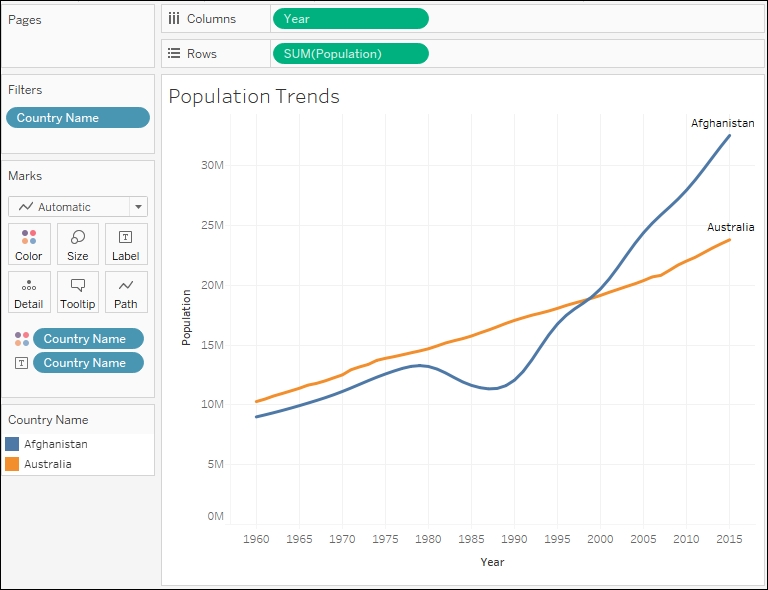
From this visualization alone you can make several interesting observations. The growth of the two countries' populations was fairly similar up to 1980. At that point the population of Afghanistan went into decline until 1988 when the population of Afghanistan started to increase recover. At some point around 1996 the population of Afghanistan exceeded that of Australia. The gap has grown wider ever since.

While we have a sense of the two trends, they become even...

lock icon The rest of the chapter is locked
Register for a free Packt account to unlock a world of extra content!
A free Packt account unlocks extra newsletters, articles, discounted offers, and much more. Start advancing your knowledge today.
Unlock this book and the full library FREE for 7 days
Get unlimited access to 7000+ expert-authored eBooks and videos courses covering every tech area you can think of
Renews at $15.99/month. Cancel anytime
Visually different images