
Process monitoring tools – top, iostat, and vmstat
We can view the native performance of various processes in an OS by using the following tools:
- To view a dynamic real-time view of the running processes in an OS, use the following command:
$ top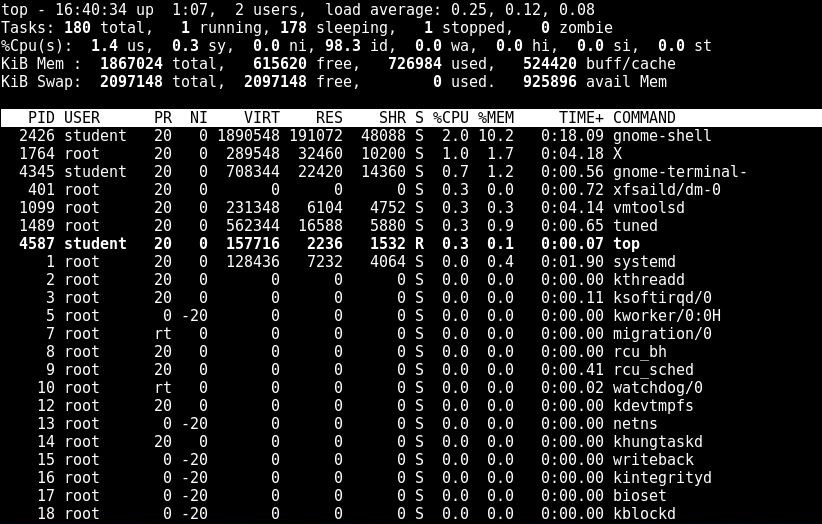
An explanation of the top command generated output is as follows:
The $top command displays a lot of information about the running system.
The first line of the display is shown as follows:

The description of fields in the first line is as follows:
- Current time
- System uptime
- Number of users logged in
- Load average of
5,10, and15minutes, respectively
The second line is shown as follows:

This line shows the summary of tasks or processes. It shows the total number of all the processes, which includes the total number of running, sleeping, stopped, and zombie processes. The third line is shown as follows:

This line shows information about CPU usage as a % in different modes as follows:
* us (user): CPU usage in%for running (un-niced) user processes* sy (system...