
Service dashboards
The executive board of Anutosh Infotech spends a lot of time checking customer satisfaction. They want to build a dashboard that can give them an easy way to understand customer services and help them improve their customer relationships. They want the following information on the dashboard:
- Number of open cases by country in the current year
- KPI for total open cases, closed cases, and total cases in the current year
- Count of cases closed every month by account sources
- Filter option to control lenses on the dashboard
Customer service dashboard – VP
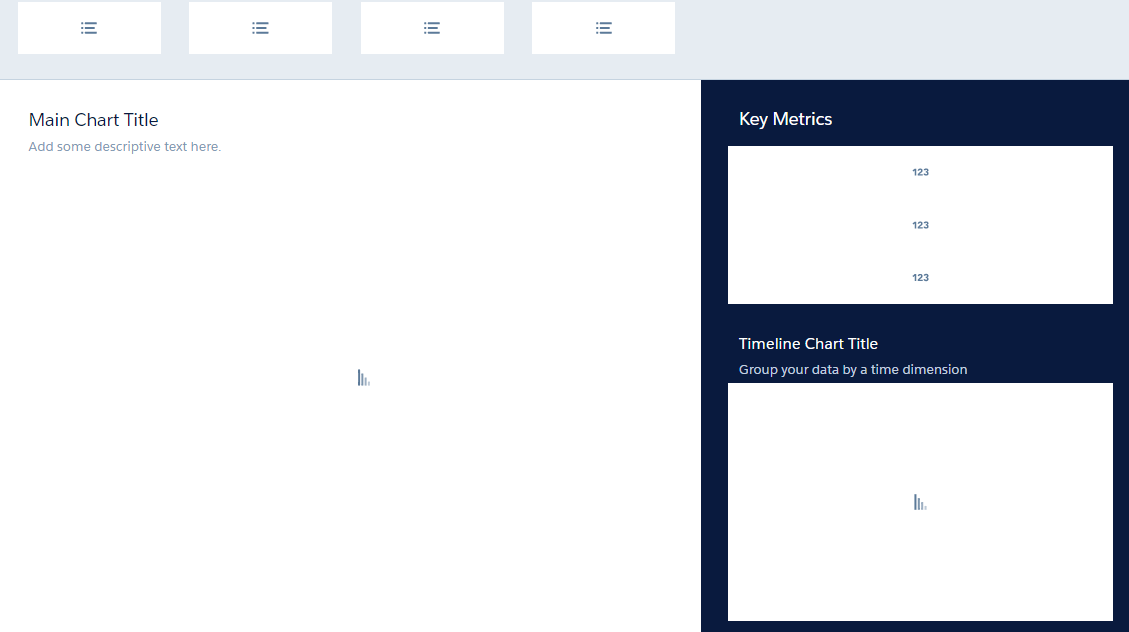
We are going to create a customer service dashboard. Let's set up a dashboard layout first, with the following widgets:
- Add four
Listwidgets horizontally - One
Togglewidget - Three
Numberwidgets for KPI - Two
Chartwidgets - Three
Textwidgets
Adjust the layout, as shown in the following screenshot:
Dashboards and lenses
Now that we have set the template for the dashboard, let's create the steps/lenses for the widgets.