Search icon CANCEL
Subscription
0
Cart icon
Your Cart (0 item)
Close icon
You have no products in your basket yet
Save more on your purchases! discount-offer-chevron-icon
Savings automatically calculated. No voucher code required.
Arrow left icon
All Products
Best Sellers
New Releases
Books
Videos
Audiobooks
Learning Hub
Newsletter Hub
Free Learning
Arrow right icon
timer SALE ENDS IN
0 Days
:
00 Hours
:
00 Minutes
:
00 Seconds
Arrow up icon
GO TO TOP
Ceph Cookbook

You're reading from   Ceph Cookbook Practical recipes to design, implement, operate, and manage Ceph storage systems

Arrow left icon
Product type Paperback
Published in Nov 2017
Publisher Packt
ISBN-13 9781788391061
Length 466 pages
Edition 2nd Edition
Languages
Tools
Arrow right icon
Authors (3):
Arrow left icon
Karan Singh Karan Singh
Author Profile Icon Karan Singh
Karan Singh
 Hackett Hackett
Author Profile Icon Hackett
Hackett
 Umrao Umrao
Author Profile Icon Umrao
Umrao
Arrow right icon
View More author details
Toc

Table of Contents (23) Chapters Close

Title Page
Credits
Disclaimer
Foreword
About the Authors
About the Reviewer
www.PacktPub.com
Customer Feedback
Preface
1. Ceph – Introduction and Beyond FREE CHAPTER 2. Working with Ceph Block Device 3. Working with Ceph and OpenStack 4. Working with Ceph Object Storage 5. Working with Ceph Object Storage Multi-Site v2 6. Working with the Ceph Filesystem 7. Monitoring Ceph Clusters 8. Operating and Managing a Ceph Cluster 9. Ceph under the Hood 10. Production Planning and Performance Tuning for Ceph 11. The Virtual Storage Manager for Ceph 12. More on Ceph 13. An Introduction to Troubleshooting Ceph 14. Upgrading Your Ceph Cluster from Hammer to Jewel

Profiling Ceph memory


Memory profiling is the process of dynamic program analysis using TCMalloc to determine a program's memory consumption and identify ways to optimize it. In this recipe, we discuss how you can use memory profilers on the Ceph daemons for memory investigation.

How to do it...

Let's see how to profile memory use for the Ceph daemons running on our nodes:

  1. Start the memory profiler on a specific daemon:
        # ceph tell osd.2 heap start_profiler

Note

To auto-start the profiler as soon as the Ceph osd daemon starts, set the environment variable as CEPH_HEAP_PROFILER_INIT=true. It's a good idea to keep the profiler running for a few hours so that it can collect as much information related to the memory footprint as possible. At the same time, you can also generate some load on the cluster.

  1. Next, print heap statistics about the memory footprint that the profiler has collected:
        # ceph tell osd.2 heap stats

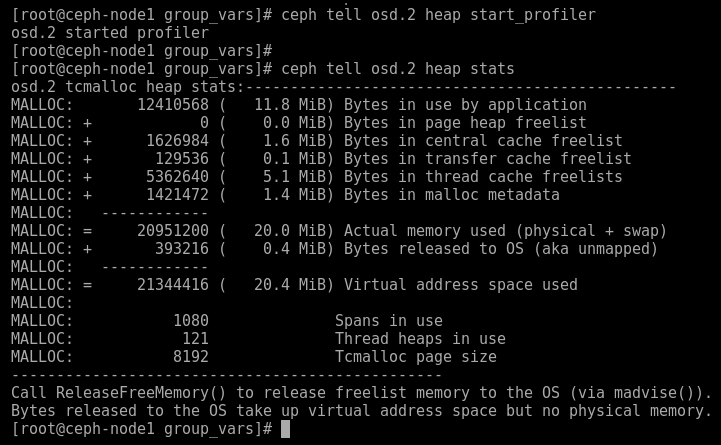
  1. You can also dump heap stats on a file that can be used later; by default...
lock icon The rest of the chapter is locked
Register for a free Packt account to unlock a world of extra content!
A free Packt account unlocks extra newsletters, articles, discounted offers, and much more. Start advancing your knowledge today.
Unlock this book and the full library FREE for 7 days
Get unlimited access to 7000+ expert-authored eBooks and videos courses covering every tech area you can think of
Renews at $15.99/month. Cancel anytime
Visually different images