If slow QA processes bottleneck you or your software engineering team and you’re releasing slower because of it — you must check out QA Wolf.
Their AI-native approach gets your team to 80% automated end-to-end test coverage and helps them ship 5x faster by reducing QA cycles from hours to minutes.
Sponsored
🗞️ Welcome to BIPro #85 – Your Weekly BI Power-Up! 🚀
Dive into this week’s top insights, tools, and strategies to supercharge your data journey!
📊Future of Data: Trends and Tools
✦ Master Time-Series Visualization:Innovative ways to visualize complex data.
✦ SQL Server Redefined:Revamp legacy architecture with Microsoft Fabric.
✦ Python for Visuals:Level up your charts with Matplotlib.
✦ AI Simplified:Harness the Naive Bayes model for smarter decisions.
✦ Quick Conversion:Turn Excel files into CSVs effortlessly with Fabric.
🔄Transformations in Action: Real-World BI
✦ Streamline with Microservices:Azure Container Apps meet Dapr and Bicep.
✦ Language Models in Action:Integrate LLMs into your systems.
✦ SQL Pro Tips:Advanced techniques to tackle complex data tasks.
✦ Scalable Pipelines:Essential tips for robust data systems.
✦ AI Ethics Explored:Dive into the moral dilemmas of machine intelligence.
⚡Instant Impact: BI Hacks You’ll Love
✦ Fabric Features Rundown:What’s new this November.
✦ AI’s Economic Shift:Automation’s impact on the workforce.
✦ BI Fundamentals:Understanding the bias-variance tradeoff.
✦ Power BI Upgrades:Latest features to boost your dashboards.
✦ DIY Smart Assistant:Build your own with agents and tools.
✦ Generative Search Simplified:Deploy VerifAI locally with ease.
🎤Industry Voices: BI Wisdom in Action
✦ Analytics Made Easy:How one leader simplifies BI for impact.
✦ Cassandra to Spanner Made Easy:New proxy adapter simplifies migrations.
✦ Smarter Chatbots:Build self-escalating agents with advanced tools.
✦ Gen AI in Finance:How Commerzbank is reinventing advisory workflows.
✦ Custom Visuals:Create stunning charts with Amazon QuickSight + Highcharts.
✦ Productivity Boosters:Enhance visuals in Amazon QuickSight with imports.
Get ready for this week’s latest BI trends, strategies, and insights to fuel your data-driven success!
Calling All Data & BI Enthusiasts!
Do you dream of sharing your insights and building your reputation in the Data & BI community? Contribute to our new column in the Packt BIPro newsletter! Share your experiences, discuss new BI tools, or ask questions. Gain recognition among 37,000 BI professionals. Reply with your Google Docs article or use our weekly feedback form. Enjoy a free PDF of "Interactive Data Visualization with Python - Second Edition" for participating. Click reply or share your content today!
Share your thoughts and opinions here!
Cheers,
Merlyn Shelley
Editor-in-Chief, Packt
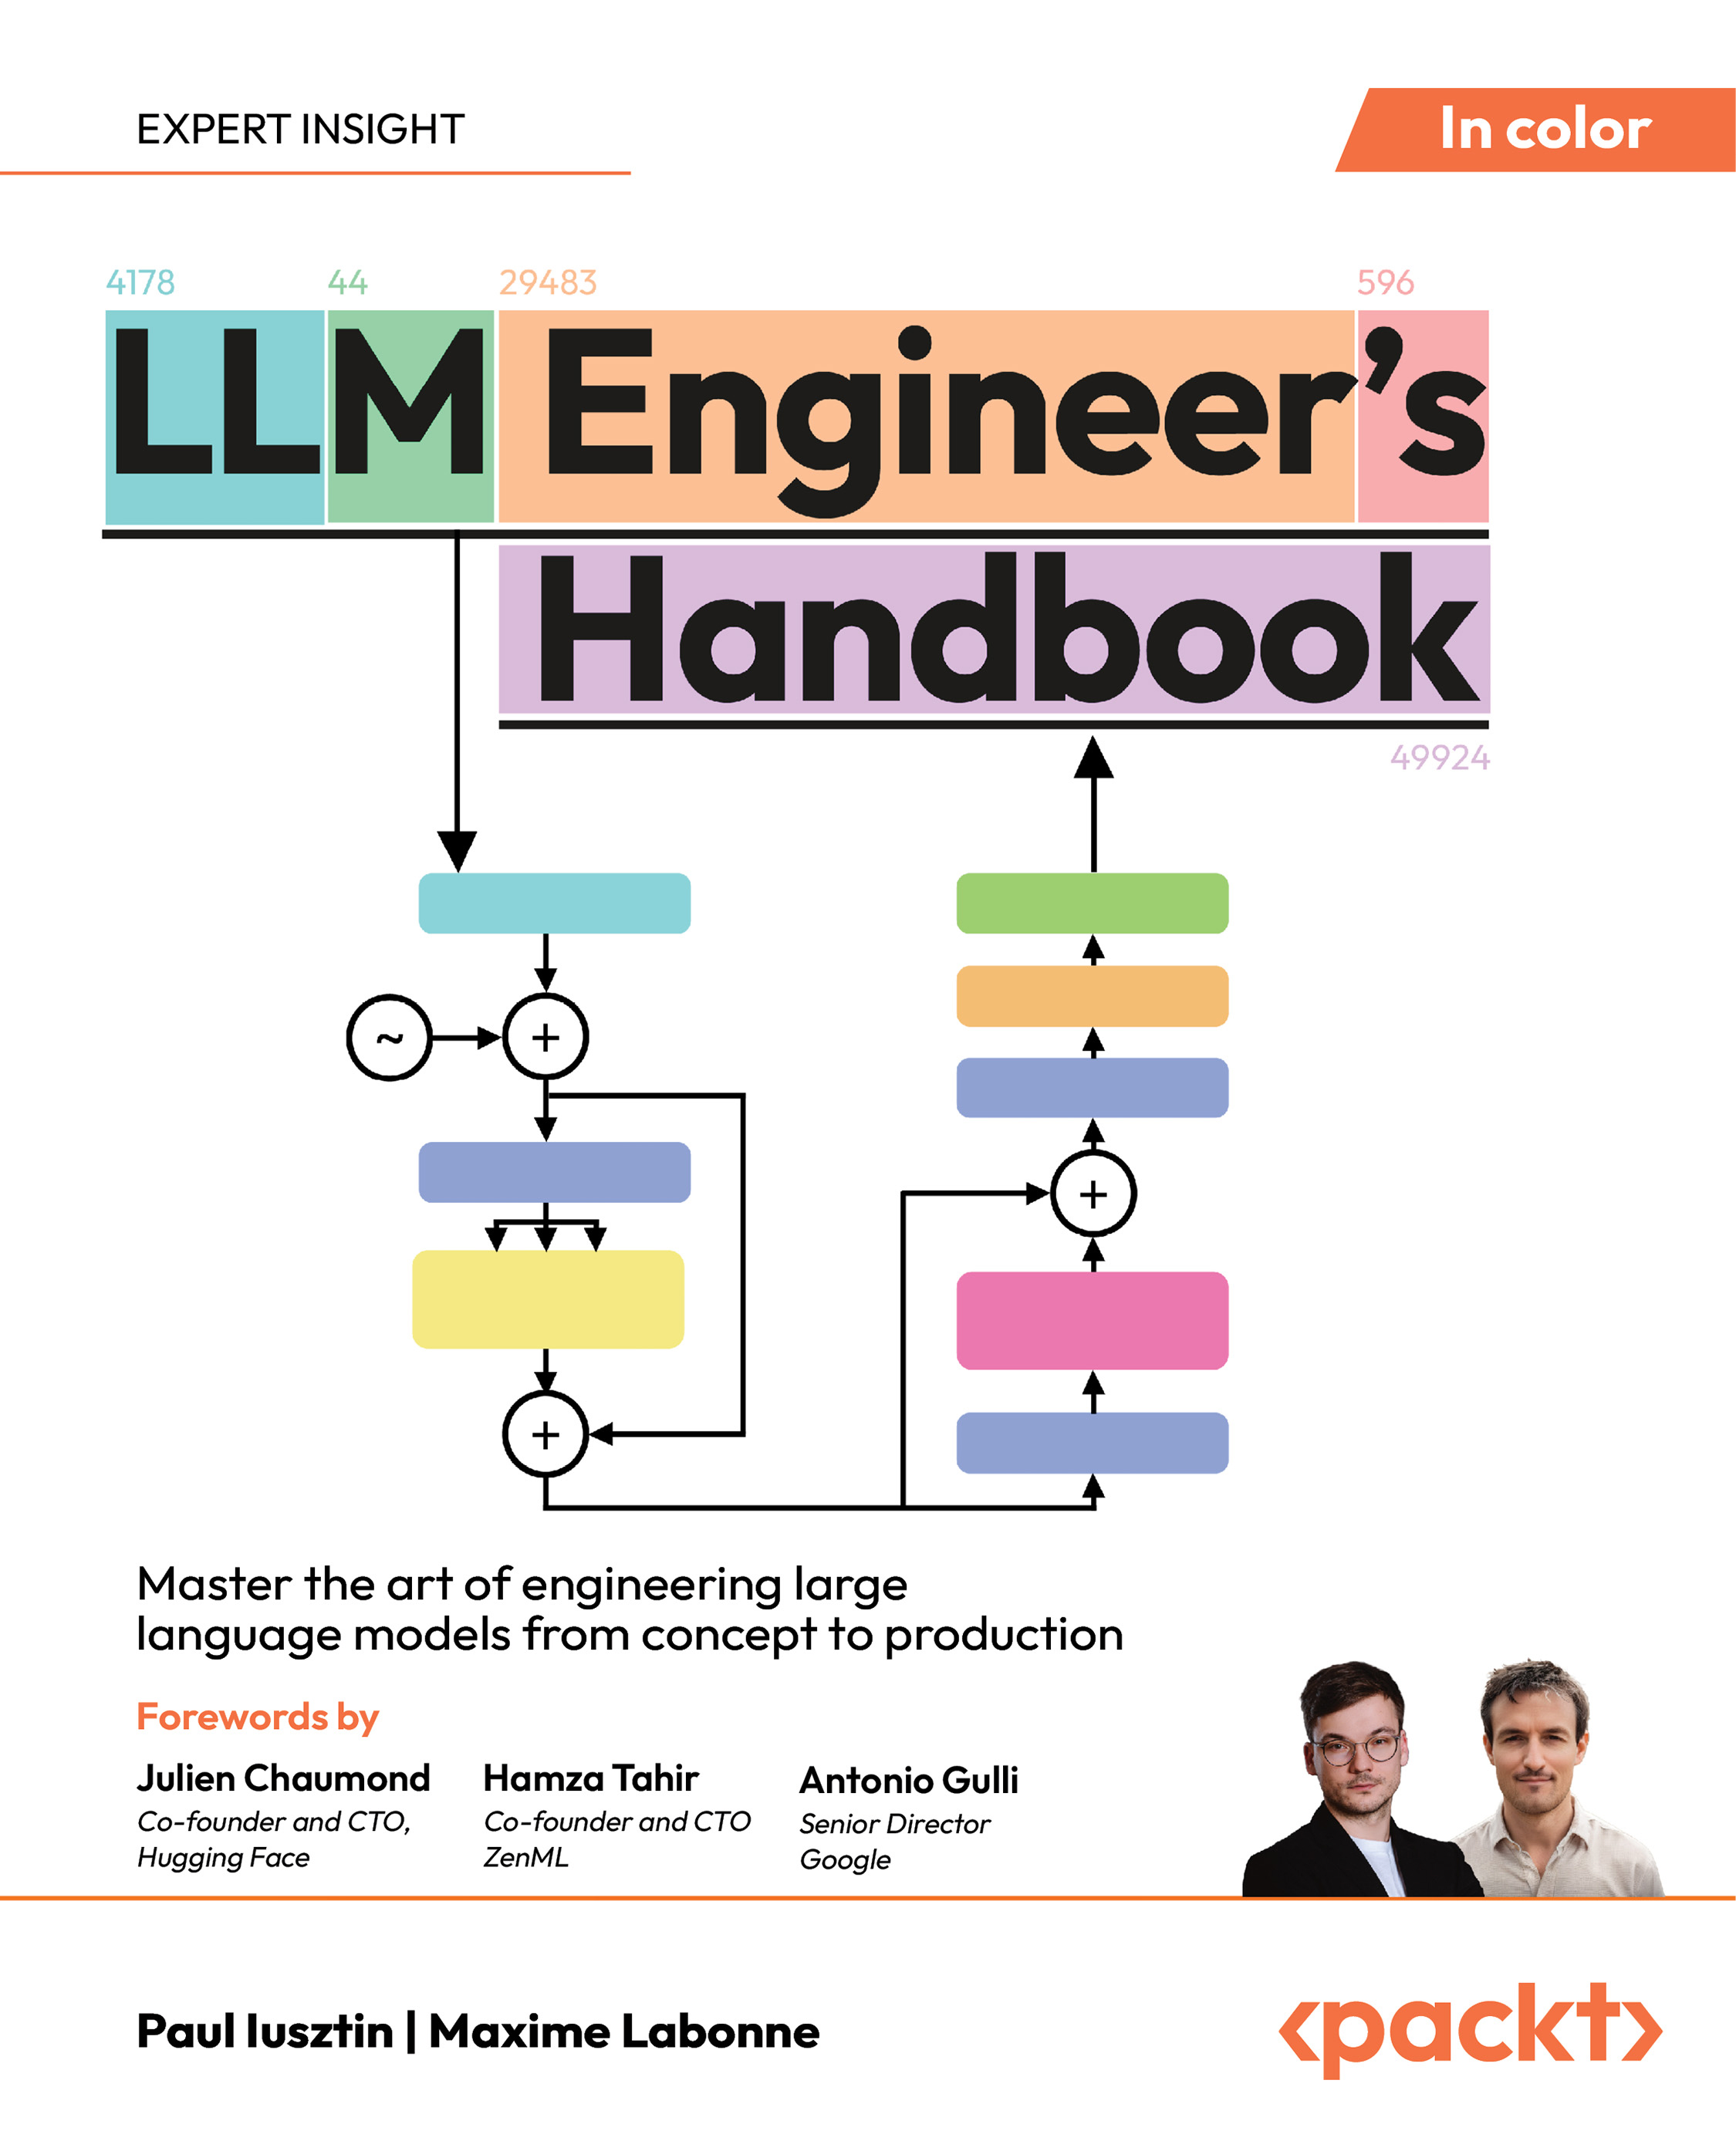
➽Learn Microsoft Fabric: Explore Microsoft Fabric's features through real-world examples to build robust data analytics solutions, including lakehouses and data warehouses. Learn to monitor and manage your analytics system for flexibility, performance, and security, while leveraging AI-driven insights with Copilot integration. Start your free trial for access, renewing at $19.99/month.
➽Microsoft Power BI Cookbook - Third Edition: Dive into Microsoft Data Fabric to enhance data strategies and gain deeper insights. Effortlessly create Hybrid tables and comprehensive scorecards while utilizing new visualization tools that transform complex data into clear, actionable charts and reports for effective decision-making in Power BI. Start your free trial for access, renewing at $19.99/month.
➽Fundamentals of Analytics Engineering: Explore how analytics engineering aligns with your organization's data strategy while gaining insights from seven industry experts. Address common challenges faced by businesses and learn to implement scalable analytics solutions, from data ingestion to visualization, using industry-leading tools. Start your free trial for access, renewing at $19.99/month.
➽Getting Started with DuckDB: Utilize DuckDB to efficiently load, transform, and query diverse data sources and formats. Gain hands-on experience with SQL, Python, and R for data analysis, while exploring how open-source tools and cloud services enhance DuckDB’s versatile capabilities in the data ecosystem. Start your free trial for access, renewing at $19.99/month.
⫸ How to visualize time-series data? This blog dives into time-series visualization best practices, offering guidance on chart selection, data structuring, and advanced techniques. It includes a cheat sheet and webinar insights for creating impactful, clear visualizations tailored to specific time-based data patterns.
⫸ Modernize a Traditional SQL Server Architecture with Fabric: This blog explores modernizing traditional SQL Server architectures with Microsoft Fabric, highlighting benefits like scalability, cost-effectiveness, and real-time analytics. It covers hybrid approaches, SaaS advantages, limitations, and a step-by-step project plan for implementation.
⫸ Data Visualization with Python Matplotlib: This blog explores the various use cases of Python's Matplotlib library for data visualization and pattern recognition. It demonstrates how to create and customize line and bar charts. It highlights visualization as a crucial step in data analysis to uncover complex datasets' patterns, trends, and relationships.
⫸ Naive Bayes Model for Machine Learning and AI: This blog introduces the Naïve Bayes classifier, a foundational machine learning model ideal for those who are just starting with the data career. It explains probability basics, conditional probability, Bayes' Theorem, and demonstrates implementing Naïve Bayes in Python for intuitive classification tasks.
⫸ Convert Excel Workbooks to CSV with Microsoft Fabric: This blog explains how to convert Excel files to CSV using Azure Data Factory in Microsoft Fabric. It covers the step-by-step process, highlights use cases, and addresses challenges, enabling easyintegration of Excel data into Delta Lake tables for advanced data management.
⫸ Microservice Application with Azure Container Apps, Dapr and Bicep: This blog addresses the challenges of managing microservice infrastructure in the cloud by introducingBicep, a domain-specific language for deploying Azure resources. This guide helps you through creating and deploying microservice applications with Azure Container Apps, Dapr, and Bicep templates,with an emphasis on modularity and automation.
⫸ Integrating Language Models into Existing Software Systems: Here you’ll learn the rising impact ofLarge Language Models (LLMs), their real-world applications, and practical methodsto integrate them into existing software infrastructure. It highlights their utility for developers, non-developers, and diverse industries while offering guidance on model selection, integration mechanisms, and hosting options.
⫸ 7 Advanced SQL Techniques for Data Manipulation in Data Science: This is aboutadvanced SQL techniquesfor data manipulation in data science, including subqueries, CTEs, recursive queries, window functions, set operators, and GROUP BY extensions. You will get to know when and how to use these powerful tools for deeper, more efficient data analysis.
⫸ 5 Tips for Building Scalable Data Pipelines: This blog dive deep into the importance ofhighly scalable data pipelinesin today’s data-driven world. It explains key pipeline stages, common scalability challenges, and tools to overcome them. Real-world scenarios, like scaling during high-traffic events, demonstrate how businesses can ensure efficient, reliable data flow.
⫸ Exploring Ethics and Morality Through Machine Intelligence: This blog probesintomachine ethics, exploring challenges in aligning AI behavior with human values and examining frameworks for responsible AI. Using examples like Delphi and ethical dilemmas in autonomous vehicles, it raises critical questions about whose principles AI should follow and the path to establishing global ethical standards.
⫸ Fabric November 2024 Feature Summary: This update is about theNovember 2024 Microsoft Fabric enhancements, featuring new tools and capabilities to elevate your data experience. Highlights include the preview launch of Fabric SQL Database, Copilot in Power BI mobile apps, Real-Time Dashboards, and expanded mirroring options for Azure SQL. Stay informed with sessions on SQL databases, certifications, and upcoming events like Microsoft Ignite 2024 and FabCon 2025 to explore these innovations further.
⫸ The Economics of Artificial Intelligence — What Does Automation Mean for Workers? This article examines theeconomic impact of AI, highlighting its effects on jobs, productivity, and labor dynamics. Using a task-based economic framework, it explores how AI innovations automate or augment tasks, reshape labor markets, and create new opportunities.
⫸ Bias-Variance Tradeoff: This piece focuses on the bias-variance tradeoff, a key concept in predictive modeling. Instead of sticking to theory, it uses real-world data to explain underfitting, overfitting, and why finding the right balance matters. Step by step, it shows how to build and improve models effectively.
⫸ Power BI November 2024 Feature Summary: This update highlights exciting features likeCopilot in Power BI Mobile apps, enabling AI-driven insights on the go, and thePath Layer for Azure Map visuals, enhancing geospatial analysis. Additionally, it introduces theOneLake catalogfor ease ofdata management and announces certifications and upcoming events likeIgnite 2024andFabCon 2025.
⫸ Build your Personal Assistant with Agents and Tools: This post explores addressing the limitations of LLMs by incorporatingAgents, Tools, and Chainsto enhance functionality. It covers creating simple chats, integrating tools for real-time tasks, adding memory, implementing human validation, and leveraging search capabilities for dynamic, actionable responses.
⫸ How to Easily Deploy a Local Generative Search Engine Using VerifAI? This post introducesVerifAI Core, an updated generative search engine allowing you to index local files and create personalized search systems. It explains its architecture, including indexing, retrieval-augmented generation, and verification, while providing setup instructions and practical use cases.
⫸ How One Data Leader Makes Analytics Less Intimidating and More Actionable? This post showcases how Darrick Bartley, an analytics leader at Charlie’s Produce, has transformed the organization into a data-driven culture. Through Tableau training, interactive visualizations, and leadership engagement, he’s made data analytics approachable, fostering better decision-making and operational efficiency across the company.
⫸ New proxy adapter eases Cassandra to Spanner migration: This post introduces theCassandra to Spanner Proxy Adapter, a tool enabling effortlessmigration from Cassandra to Spanner without altering application logic. It highlights Spanner’s advanced features, success stories from Yahoo and Reltio, and a simplified migration process for modernizing data infrastructure.
⫸ Create a self-escalating chatbot in Conversational Agents using Webhook and Generators: This post explains how to create aself-escalating chatbotusing Google Cloud’s AI tools like Vertex AI and Dialogflow CX. It outlines steps to build a knowledge base, gauge user satisfaction, escalate queries with generative AI, and integrate email triggers using Cloud Run Functions for a hassle-freeuser experience.
⫸ How Commerzbank is transforming financial advisory workflows with gen AI: This post highlights how Commerzbank partnered with Google Cloud to implement an AI-powered automation system for financial advisory workflows. Leveraging tools like Vertex AI and Gemini 1.5 Pro, the solution streamlines documentation processes, boosts sales advisor productivity, and enhances client service efficiency, reducing manual workloads and accelerating task completion.
⫸ Create custom charts in Amazon QuickSight using the Highcharts visual: This post introduces theHighcharts visual in Amazon QuickSight, empowering users to design tailored visualizations like packed bubble and lipstick column charts. With support for Highcharts JSON schema, this new feature enhances flexibility, branding, and interactivity while streamlining dashboard creation within QuickSight.
⫸ Boost productivity with imported visuals in Amazon QuickSight: This post introduces theImport Visuals feature in Amazon QuickSight, allowing users to reuse visuals from existing dashboards or analyses with ease. By simplifying dashboard creation, enhancing collaboration, and reducing development time, this feature helps organizations maintain consistency and improve productivity in data visualization workflows.