In this article by Bahaaldine Azarmi, the author of the book Learning Kibana 5.0, we will learn about metric analytics, which is fundamentally different in terms of data structure.
(For more resources related to this topic, see here.)
Author would like to spend a few lines on the following question: What is a metric?
A metric is an event that contains a timestamp and usually one or more numeric values. It is appended to a metric file sequentially, where all lines of metrics are ordered based on the timestamp. As an example, here are a few system metrics:
02:30:00 AM all 2.58 0.00 0.70 1.12 0.05 95.55
02:40:00 AM all 2.56 0.00 0.69 1.05 0.04 95.66
02:50:00 AM all 2.64 0.00 0.65 1.15 0.05 95.50
Unlike logs, metrics are sent periodically, for example, every 10 minutes (as the preceding example illustrates) whereas logs are usually appended to the log file when something happens.
Metrics are often used in the context of software or hardware health monitoring, such as resource utilization monitoring, database execution metrics monitoring, and so on.
Since version 5.0, Elastic had, at all layers of the solutions, new features to enhance the user experience of metrics management and analytics. Metricbeat is one of the new features in 5.0. It allows the user to ship metrics data, whether from the machine or from applications, to Elasticsearch, and comes with out-of-the-box dashboards for Kibana. Kibana also integrates Timelion with its core, a plugin which has been made for manipulating numeric data, such as metrics.
In this article, we'll start by working with Metricbeat.
Metricbeat in Kibana
The procedure to import the dashboard has been laid out in the subsequent section.
Importing the dashboard
Before importing the dashboard, let's have a look at the actual metric data that Metricbeat ships. As I have Chrome opened while typing this article, I'm going to filter the data by process name, here chrome:

Discover tab filtered by process name
Here is an example of one of the documents I have:
{
  "_index": "metricbeat-2016.09.06",
  "_type": "metricsets",
  "_id": "AVcBFstEVDHwfzZYZHB8",
  "_score": 4.29527,
  "_source": {
    "@timestamp": "2016-09-06T20:00:53.545Z",
    "beat": {
      "hostname": "MacBook-Pro-de-Bahaaldine.local",
      "name": "MacBook-Pro-de-Bahaaldine.local"
    },
    "metricset": {
      "module": "system",
      "name": "process",
      "rtt": 5916
    },
    "system": {
      "process": {
        "cmdline": "/Applications/Google Chrome.app/Contents/Versions/52.0.2743.116/Google Chrome Helper.app/Contents/MacOS/Google Chrome Helper --type=ppapi --channel=55142.2188.1032368744 --ppapi-flash-args --lang=fr",
        "cpu": {
          "start_time": "09:52",
          "total": {
            "pct": 0.0035
          }
        },
        "memory": {
          "rss": {
            "bytes": 67813376,
            "pct": 0.0039
          },
          "share": 0,
          "size": 3355303936
        },
        "name": "Google Chrome H",
        "pid": 76273,
        "ppid": 55142,
        "state": "running",
        "username": "bahaaldine"
      }
    },
    "type": "metricsets"
  },
  "fields": {
    "@timestamp": [
      1473192053545
    ]
  }
}
Metricbeat document example
The preceding document breaks down the utilization of resources for the chrome process. We can see, for example, the usage of CPU and memory, as well as the state of the process as a whole. Now how about visualizing the data in an actual dashboard? To do so, go into the Kibana folder located in the Metricbeat installation directory:
MacBook-Pro-de-Bahaaldine:kibana bahaaldine$ pwd
/elastic/metricbeat-5.0.0/kibana
MacBook-Pro-de-Bahaaldine:kibana bahaaldine$ ls
dashboard
import_dashboards.ps1
import_dashboards.sh
index-pattern
search
visualization
import_dashboards.sh is the file we will use to import the dashboards in Kibana. Execute the file script like the following:
./import_dashboards.sh –h
This should print out the help, which, essentially, will give you the list of arguments you can pass to the script. Here, we need to specify a username and a password as we are using the X-Pack security plugin, which secures our cluster:
Unlock access to the largest independent learning library in Tech for FREE!
Get unlimited access to 7500+ expert-authored eBooks and video courses covering every tech area you can think of.
Renews at $15.99/month. Cancel anytime
./import_dashboards.sh –u elastic:changeme
You should normally get a bunch of logs stating that dashboards have been imported, as shown in the following example:
Import visualization Servers-overview:
{"_index":".kibana","_type":"visualization","_id":"Servers-overview","_version":4,"forced_refresh":false,"_shards":{"total":2,"successful":1,"failed":0},"created":false}
Now, at this point, you have metric data in Elasticsearch and dashboards created in Kibana, so you can now visualize the data.
Visualizing metrics
If you go back into the Kibana/dashboard section and try to open the Metricbeat System Statistics dashboard, you should get something similar to the following:
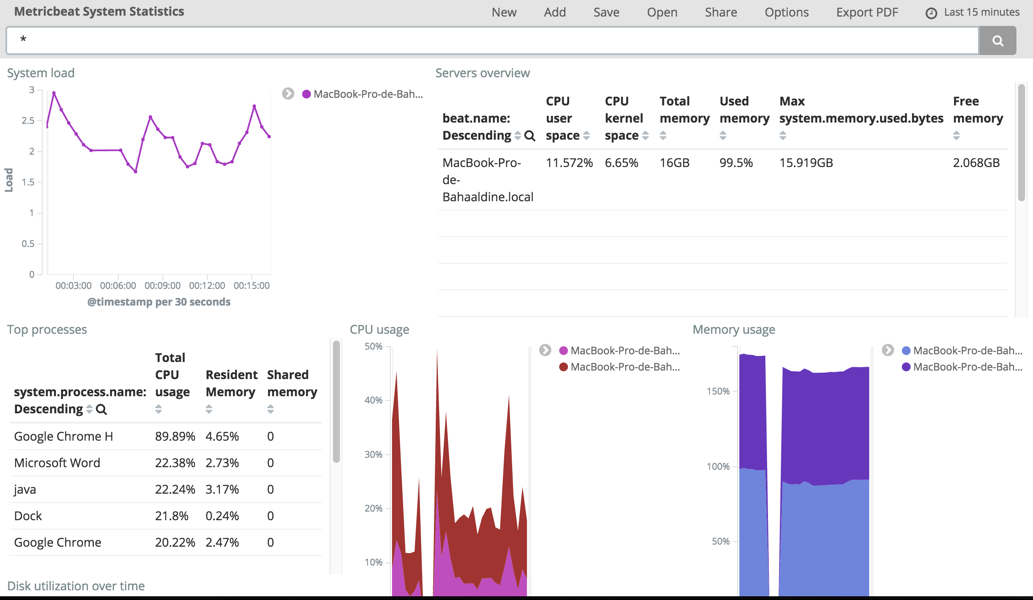
Metricbeat Kibana dashboard
You should see in your own dashboard the metric based on the processes that are running on your computer. In my case, I have a bunch of them for which I can visualize the CPU and memory utilization, for example:

RAM and CPU utilization
As an example, what can be important here is to be sure that Metricbeat has a very low footprint on the overall system in terms of CPU or RAM, as shown here:

Metricbeat resource utilization
As we can see in the preceding diagram, Metricbeat only uses about 0.4% of the CPU and less than 0.1% of the memory on my Macbook Pro. On the other hand, if I want to get the most resource-consuming processes, I can check in the Top processes data table, which gives the following information:

Top processes
Besides Google Chrome H, which uses a lot of CPU, zoom.us, a conferencing application, seems to bring a lot of stress to my laptop.
Rather than using the Kibana standard visualization to manipulate our metrics, we'll use Timelion instead, and focus on this heavy CPU consuming processes use case.
Summary
In this article, we have seen how we can use Kibana in the context of technical metric analytics. We relied on the data that Metricbeat is able to ship from a machine and visualized the result both in Kibana dashboard and in Kibana Timelion.
Resources for Article:
Further resources on this subject:

 United States
 Great Britain
 India
India
 Germany
 France
 Canada
 Russia
 Spain
Spain
 Brazil
 Australia
 South Africa
 Thailand
 Ukraine
 Switzerland
 Slovakia
 Luxembourg
 Hungary
 Romania
 Denmark
 Ireland
 Estonia
 Belgium
 Italy
Italy
 Finland
 Cyprus
 Lithuania
 Latvia
 Malta
Malta
 Netherlands
 Portugal
 Slovenia
 Sweden
 Argentina
 Colombia
 Ecuador
 Indonesia
 Mexico
 New Zealand
 Norway
 South Korea
 Taiwan
 Turkey
 Czechia
 Austria
 Greece
 Isle of Man
 Bulgaria
 Japan
Japan
 Philippines
 Poland
 Singapore
 Egypt
Egypt
 Chile
Chile
 Malaysia


