In this article by Josh Diakun, Paul R Johnson, and Derek Mock, authors of Splunk Operational Intelligence Cookbook, we will take a look at how to load sample data into Splunk, how to create an application, and how to add dashboards and reports in Splunk.
(For more resources related to this topic, see here.)
Loading the sample data
While most of the data you will index with Splunk will be collected in real time, there might be instances where you have a set of data that you would like to put into Splunk, either to backfill some missing or incomplete data, or just to take advantage of its searching and reporting tools.
This recipe will show you how to perform one-time bulk loads of data from files located on the Splunk server. We will also use this recipe to load the data samples that will be used as we build our Operational Intelligence app in Splunk.
There are two files that make up our sample data. The first is access_log, which represents data from our web layer and is modeled on an Apache web server. The second file is app_log, which represents data from our application layer and is modeled on the log4j application log data.
Getting ready
To step through this recipe, you will need a running Splunk server and should have a copy of the sample data generation app (OpsDataGen.spl). (This file is part of the downloadable code bundle, which is available on the book's website.)
How to do it...
Follow the given steps to load the sample data generator on your system:
- Log in to your Splunk server using your credentials.
- From the home launcher, select the Apps menu in the top-left corner and click on Manage Apps.

- Select Install App from file.

- Select the location of the OpsDataGen.spl file on your computer, and then click on the Upload button to install the application.

- After installation, a message should appear in a blue bar at the top of the screen, letting you know that the app has installed successfully. You should also now see the OpsDataGen app in the list of apps.

- By default, the app installs with the data-generation scripts disabled. In order to generate data, you will need to enable either a Windows or Linux script, depending on your Splunk operating system. To enable the script, select the Settings menu from the top-right corner of the screen, and then select Data inputs.

- From the Data inputs screen that follows, select Scripts.
- On the Scripts screen, locate the OpsDataGen script for your operating system and click on Enable.
- For Linux, it will be $SPLUNK_HOME/etc/apps/OpsDataGen/bin/AppGen.path
- For Windows, it will be $SPLUNK_HOMEetcappsOpsDataGenbinAppGen-win.path
The following screenshot displays both the Windows and Linux inputs that are available after installing the OpsDataGen app. It also displays where to click to enable the correct one based on the operating system Splunk is installed on.

- Select the Settings menu from the top-right corner of the screen, select Data inputs, and then select Files & directories.
- On the Files & directories screen, locate the two OpsDataGen inputs for your operating system and for each click on Enable.
- For Linux, it will be:
$SPLUNK_HOME/etc/apps/OpsDataGen/data/access_log
$SPLUNK_HOME/etc/apps/OpsDataGen/data/app_log
- For Windows, it will be:
$SPLUNK_HOMEetcappsOpsDataGendataaccess_log
$SPLUNK_HOMEetcappsOpsDataGendataapp_log
The following screenshot displays both the Windows and Linux inputs that are available after installing the OpsDataGen app. It also displays where to click to enable the correct one based on the operating system Splunk is installed on.
- The data will now be generated in real time. You can test this by navigating to the Splunk search screen and running the following search over an All time (real-time) time range:
index=main sourcetype=log4j OR sourcetype=access_combined
After a short while, you should see data from both source types flowing into Splunk, and the data generation is now working as displayed in the following screenshot:

How it works...
In this case, you installed a Splunk application that leverages a scripted input. The script we wrote generates data for two source types. The access_combined source type contains sample web access logs, and the log4j source type contains application logs.
Creating an Operational Intelligence application
This recipe will show you how to create an empty Splunk app that we will use as the starting point in building our Operational Intelligence application.
Getting ready
To step through this recipe, you will need a running Splunk Enterprise server, with the sample data loaded from the previous recipe. You should be familiar with navigating the Splunk user interface.
How to do it...
Follow the given steps to create the Operational Intelligence application:
- Log in to your Splunk server.
- From the top menu, select Apps and then select Manage Apps.

- Click on the Create app button.

- Complete the fields in the box that follows. Name the app Operational Intelligence and give it a folder name of operational_intelligence. Add in a version number and provide an author name. Ensure that Visible is set to Yes, and the barebones template is selected.

- When the form is completed, click on Save. This should be followed by a blue bar with the message, Successfully saved operational_intelligence.
Congratulations, you just created a Splunk application!
How it works...
When an app is created through the Splunk GUI, as in this recipe, Splunk essentially creates a new folder (or directory) named operational_intelligence within the $SPLUNK_HOME/etc/apps directory. Within the $SPLUNK_HOME/etc/apps/operational_intelligence directory, you will find four new subdirectories that contain all the configuration files needed for our barebones Operational Intelligence app that we just created.

The eagle-eyed among you would have noticed that there were two templates, barebones and sample_app, out of which any one could have been selected when creating the app. The barebones template creates an application with nothing much inside of it, and the sample_app template creates an application populated with sample dashboards, searches, views, menus, and reports. If you wish to, you can also develop your own custom template if you create lots of apps, which might enforce certain color schemes for example.
There's more...
As Splunk apps are just a collection of directories and files, there are other methods to add apps to your Splunk Enterprise deployment.
Creating an application from another application
It is relatively simple to create a new app from an existing app without going through the Splunk GUI, should you wish to do so. This approach can be very useful when we are creating multiple apps with different inputs.conf files for deployment to Splunk Universal Forwarders.
Taking the app we just created as an example, copy the entire directory structure of the operational_intelligence app and name it copied_app.
Unlock access to the largest independent learning library in Tech for FREE!
Get unlimited access to 7500+ expert-authored eBooks and video courses covering every tech area you can think of.
Renews at €14.99/month. Cancel anytime
cp -r $SPLUNK_HOME$/etc/apps/operational_intelligence/*
 $SPLUNK_HOME$/etc/apps/copied_app
Within the directory structure of copied_app, we must now edit the app.conf file in the default directory.
Open $SPLUNK_HOME$/etc/apps/copied_app/default/app.conf and change the label field to My Copied App, provide a new description, and then save the conf file.
#
# Splunk app configuration file
#
[install]
is_configured = 0
[ui]
is_visible = 1
label = My Copied App
[launcher]
author = John Smith
description = My Copied application
version = 1.0
Now, restart Splunk, and the new My Copied App application should now be seen in the application menu.
$SPLUNK_HOME$/bin/splunk restart
Downloading and installing a Splunk app
Splunk has an entire application website with hundreds of applications, created by Splunk, other vendors, and even users of Splunk. These are great ways to get started with a base application, which you can then modify to meet your needs.
If the Splunk server that you are logged in to has access to the Internet, you can click on the Apps menu as you did earlier and then select the Find More Apps button. From here, you can search for apps and install them directly.
An alternative way to install a Splunk app is to visit http://apps.splunk.com and search for the app. You will then need to download the application locally. From your Splunk server, click on the Apps menu and then on the Manage Apps button. After that, click on the Install App from File button and upload the app you just downloaded, in order to install it.
Once the app has been installed, go and look at the directory structure that the installed application just created. Familiarize yourself with some of the key files and where they are located.
When downloading applications from the Splunk apps site, it is best practice to test and verify them in a nonproduction environment first. The Splunk apps site is community driven and, as a result, quality checks and/or technical support for some of the apps might be limited.
Adding dashboards and reports
Dashboards are a great way to present many different pieces of information. Rather than having lots of disparate dashboards across your Splunk environment, it makes a lot of sense to group related dashboards into a common Splunk application, for example, putting operational intelligence dashboards into a common Operational Intelligence application.
In this recipe, you will learn how to move the dashboards and associated reports into our new Operational Intelligence application.
Getting ready
To step through this recipe, you will need a running Splunk Enterprise server, with the sample data loaded from the Loading the sample data recipe. You should be familiar with navigating the Splunk user interface.
How to do it...
Follow these steps to move your dashboards into the new application:
- Log in to your Splunk server.
- Select the newly created Operational Intelligence application.
- From the top menu, select Settings and then select the User interface menu item.

- Click on the Views section.

- In the App Context dropdown, select Searching & Reporting (search) or whatever application you were in when creating the dashboards:

- Locate the website_monitoring dashboard row in the list of views and click on the Move link to the right of the row.
- In the Move Object pop up, select the Operational Intelligence (operational_intelligence) application that was created earlier and then click on the Move button.

- A message bar will then be displayed at the top of the screen to confirm that the dashboard was moved successfully.
- Repeat from step 5 to move the product_monitoring dashboard as well.

- After the Website Monitoring and Product Monitoring dashboards have been moved, we now want to move all the reports that were created, as these power the dashboards and provide operational intelligence insight. From the top menu, select Settings and this time select Searches, reports, and alerts.
- Select the Search & Reporting (search) context and filter by cp0* to view the searches (reports) that are created. Click on the Move link of the first cp0* search in the list.
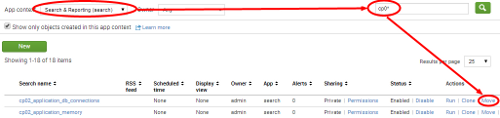
- Select to move the object to the Operational Intelligence (operational_intelligence) application and click on the Move button.
- A message bar will then be displayed at the top of the screen to confirm that the dashboard was moved successfully.
- Select the Search & Reporting (search) context and repeat from step 11 to move all the other searches over to the new Operational Intelligence application—this seems like a lot but will not take you long!
All of the dashboards and reports are now moved over to your new Operational Intelligence application.
How it works...
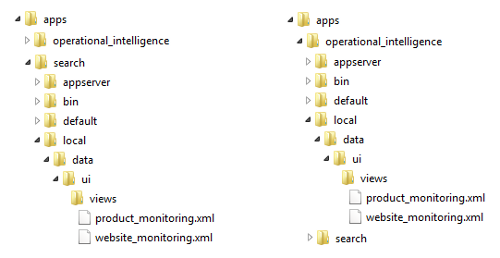
In the previous recipe, we revealed how Splunk apps are essentially just collections of directories and files. Dashboards are XML files found within the $SPLUNK_HOME/etc/apps directory structure. When moving a dashboard from one app to another, Splunk is essentially just moving the underlying file from a directory inside one app to a directory in the other app. In this recipe, you moved the dashboards from the Search & Reporting app to the Operational Intelligence app, as represented in the following screenshot:
As visualizations on the dashboards leverage the underlying saved searches (or reports), you also moved these reports to the new app so that the dashboards maintain permissions to access them. Rather than moving the saved searches, you could have changed the permissions of each search to Global such that they could be seen from all the other apps in Splunk. However, the other reason you moved the reports was to keep everything contained within a single Operational Intelligence application, which you will continue to build on going forward.
It is best practice to avoid setting permissions to Global for reports and dashboards, as this makes them available to all the other applications when they most likely do not need to be. Additionally, setting global permissions can make things a little messy from a housekeeping perspective and crowd the lists of reports and views that belong to specific applications. The exception to this rule might be for knowledge objects such as tags, event types, macros, and lookups, which often have advantages to being available across all applications.
There's more…
As you went through this recipe, you likely noticed that the dashboards had application-level permissions, but the reports had private-level permissions. The reports are private as this is the default setting in Splunk when they are created. This private-level permission restricts access to only your user account and admin users. In order to make the reports available to other users of your application, you will need to change the permissions of the reports to Shared in App as we did when adjusting the permissions of reports.
Changing the permissions of saved reports
Changing the sharing permission levels of your reports from the default Private to App is relatively straightforward:
- Ensure that you are in your newly created Operational Intelligence application.
- Select the Reports menu item to see the list of reports.
- Click on Edit next to the report you wish to change the permissions for. Then, click on Edit Permissions from the drop-down list.

- An Edit Permissions pop-up box will appear. In the Display for section, change from Owner to App, and then, click on Save.
- The box will close, and you will see that the Sharing permissions in the table will now display App for the specific report. This report will now be available to all the users of your application.
Summary
In this article, we loaded the sample data into Splunk. We also saw how to organize dashboards and knowledge into a custom Splunk app.
Resources for Article:
Further resources on this subject:

 United States
 Great Britain
 India
India
 Germany
 France
 Canada
 Russia
 Spain
Spain
 Brazil
 Australia
 South Africa
 Thailand
 Ukraine
 Switzerland
 Slovakia
 Luxembourg
 Hungary
 Romania
 Denmark
 Ireland
 Estonia
 Belgium
 Italy
Italy
 Finland
 Cyprus
 Lithuania
 Latvia
 Malta
Malta
 Netherlands
 Portugal
 Slovenia
 Sweden
 Argentina
 Colombia
 Ecuador
 Indonesia
 Mexico
 New Zealand
 Norway
 South Korea
 Taiwan
 Turkey
 Czechia
 Austria
 Greece
 Isle of Man
 Bulgaria
 Japan
Japan
 Philippines
 Poland
 Singapore
 Egypt
Egypt
 Chile
Chile
 Malaysia


