Once your PL/SQL code has successfully compiled, it is important to review it to make sure it does what is required and that it performs well. You can consider a number of approaches when tuning and testing code. These approaches include:
- Debugging—run the code and add break points to stop and inspect areas of concern.
- SQL performance—use Explain Plan results to review the performance.
- PL/SQL performance—use the PL/SQL Hierarchical Profiler to identify bottlenecks.
- Unit testing—review edge cases and general function testing. Does the code do what you intended it to do?
In this article by Sue Harper, author of Oracle SQL Developer 2.1, we'll review the debugger. We will see how to debug PL/SQL packages, procedures, and functions.
Debugging PL/SQL code
SQL and PL/SQL code may execute cleanly, and even produce an output. PL/SQL code may compile and produce results, but this is part of the task. Does it do what you are expecting it to do? Are the results accurate? Does it behave as expected for high and low values, odd dates or names? Does it behave the same way when it's called from within a program as it does when tested in isolation? Does it perform as well for massive sets of data as it does for a small test case? All of these are aspects to consider when testing code, and many can been tracked by debugging the code.
Using the debugging mechanism in SQL Developer
You will need a piece of compiled, working code. For this exercise, we will use the following piece of code:
PROCEDURE EMP_DEPTS
(P_MAXROWS VARCHAR2)
AS
CURSOR EMPDEPT_CURSOR IS
SELECT D.DEPARTMENT_NAME, E.LAST_NAME, J.JOB_TITLE
FROM DEPARTMENTS D, EMPLOYEES E, JOBS J
WHERE D.DEPARTMENT_ID = E.DEPARTMENT_ID
AND E.JOB_ID = J.JOB_ID;
EMP_RECORD EMPDEPT_CURSOR % ROWTYPE;
TYPE EMP_TAB_TYPE IS TABLE OF EMPDEPT_CURSOR % ROWTYPE INDEX BY
BINARY_INTEGER;
EMP_TAB EMP_TAB_TYPE;
I NUMBER := 1;
BEGIN
OPEN EMPDEPT_CURSOR;
FETCH EMPDEPT_CURSOR
INTO EMP_RECORD;
EMP_TAB(I) := EMP_RECORD;
WHILE((EMPDEPT_CURSOR % FOUND) AND(I <= P_MAXROWS))
LOOP I := I + 1;
FETCH EMPDEPT_CURSOR
INTO EMP_RECORD;
EMP_TAB(I) := EMP_RECORD;
END LOOP;
CLOSE EMPDEPT_CURSOR; FOR J IN REVERSE 1 .. I
LOOP DBMS_OUTPUT.PUT_LINE('THE EMPLOYEE '|| EMP_TAB(J).LAST_NAME ||
' WORKS IN DEPARTMENT '|| EMP_TAB(J).DEPARTMENT_NAME);
END LOOP;
END;
Before you can debug code, you need to have the following privileges:
- EXECUTE and DEBUG—you need to be able to execute the required procedure
- DEBUG CONNECT SESSION—to be able to debug procedures you execute in the session
Note, when granting the system privilege DEBUG ANY PROCEDURE, you are granting access to debug any procedure that you have execute privilege for and has been compiled for debug.
Using the Oracle debugging packages
Oracle provides two packages for debugging PL/SQL code. The first, DBMS_DEBUG, was introduced in Oracle 8i and is not used by newer IDEs. The second, DBMS_DEBUG_JWP, was introduced in Oracle 9i Release 2, and is used in SQL Developer when debugging sub-programs.
Debugging
When preparing to debug any code, you need to set at least one break point, and then you should select Compile for Debug. In the following screenshot, the breakpoint is set at the opening of the cursor, and the Compile for Debug option is shown in the drop-down list:

Instead of using the drop-down list to select the Compile or Compile for Debug options, just click the Compile button. This compiles the PL/SQL code using the optimization level set in the Preferences. Select Database PL/SQL Compiler|. By setting the Optimization Level preference to 0 or 1 the PL/SQL is compiled with debugging information.
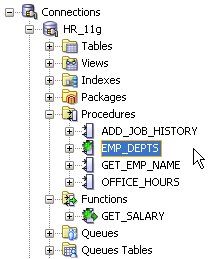
Any PL/SQL code that has been compiled for debugging will show the little green bug overlaying the regular icon in the Connections navigator. The next screenshot shows the EMP_DEPTS procedure and the GET_SALARY function have both been compiled for debug:

Compile for debug
Once you have completed a debugging session, be sure to compile again afterwards to remove any debug compiler directives. While negligible, omitting this step can have a performance impact on the PL/SQL program.
You are now ready to debug. To debug, click the Debug button in the toolbar. SQL Developer then sets the sessions to a debug session and issues the command DBMS_DEBUG_JDWP.CONNECT_TCP (hostname, port); and sets up the debug windows as shown in the following screenshot:

This connects you to a debugger session in the database. In some instances, the port selected is not open, due to firewall or other restrictions. In this case, you can have SQL Developer prompt you for the port. To set this option, open the Preferences dialog, and select the Debugger node. You can also specify the port range available for SQL Developer to use. These options mean that you can have more control over the ports used.
Unlock access to the largest independent learning library in Tech for FREE!
Get unlimited access to 7500+ expert-authored eBooks and video courses covering every tech area you can think of.
Renews at €14.99/month. Cancel anytime

Navigating through the code
The PL/SQL debugger provides a selection of buttons (or menu items) to step through individual lines of code, or to step over blocks of code. You can step through or over procedures, navigating to the point of contention or the area you wish to inspect.
Once you start stepping into the code, you can track the data as it changes. The data is displayed in a second set of tabbed dialogs. In this example, we are looping through a set of records in order for you to see how each of the windows behaves. As you start stepping into the code, the Data tab starts to display the values:

This Data tab continues to collect all of the variables as you continue to step through the code. Even if you step over and skip blocks of code, all of the code is executed and the results are gathered here.
The Smart Data tab keeps track of the same detail, but only the values immediately related to the area you are working in. This is more useful in a large procedure than in a small one like the example shown.
The context menu provides you with a set of options while debugging. These include:
- Run to Cursor—allows you to start debugging and then to quickly move to another part of the code. The code in-between is quickly executed and you can continue debugging.
- Watch—allows you to watch an expression or code while you are debugging.
- Inspect—allows you to watch values as you debug.
In the following screenshot, the current execution point is at the start of the WHILE loop. If the loop is required to loop multiple times, you can skip that and have the code execute to a point further down in the code, in this case after the cursor has been completed and closed:

The Watch and Inspect options remain set up if you stop and restart the debug session. This allows you to stop, change the input values, and start debugging and these will change according to the new parameters. You do not need to set up watch or inspector values each time you debug the procedure. The values appear in dockable windows, so you can dock or float them near the code as required:

You can modify values that you are watching. In the following example, 'i' is the counter that we're using in the loop. You can modify this value to skip over chunks of the loop, and then continue from a particular point.

Modifying values in the middle of the code can be useful, as you might want to test how the program reacts in certain circumstances. For example, before the millennium, testers may have wanted to see how code behaved, or output changed once the date switched over to the year 2000.
 United States
 Great Britain
 India
India
 Germany
 France
 Canada
 Russia
 Spain
Spain
 Brazil
 Australia
 South Africa
 Thailand
 Ukraine
 Switzerland
 Slovakia
 Luxembourg
 Hungary
 Romania
 Denmark
 Ireland
 Estonia
 Belgium
 Italy
Italy
 Finland
 Cyprus
 Lithuania
 Latvia
 Malta
Malta
 Netherlands
 Portugal
 Slovenia
 Sweden
 Argentina
 Colombia
 Ecuador
 Indonesia
 Mexico
 New Zealand
 Norway
 South Korea
 Taiwan
 Turkey
 Czechia
 Austria
 Greece
 Isle of Man
 Bulgaria
 Japan
Japan
 Philippines
 Poland
 Singapore
 Egypt
Egypt
 Chile
Chile
 Malaysia


