In this article by Steve Ivie, the author of the book, Building Dynamics CRM 2015 Dashboards with Power BI, we will explore the functionality of using Microsoft Power BI integrated with Microsoft Dynamics CRM 2015. Microsoft Dynamics CRM 2015 is a powerful sales automation and relationship management tool with fantastic built-in reporting features. However, when it comes to analyzing data, there is now a more powerful option available with Microsoft Power BI. We will show you how to build an interactive sales dashboard, which can be used by everyone (from a salesperson to the CEO).
We will build an interactive sales productivity dashboard that will answer the common salesperson's question: "How is my team doing?" We will build this dashboard with native Microsoft Power BI functionality, including charts, graphs, maps, summaries, and tiles that will be viewable in Microsoft Dynamics CRM 2015 and mobile apps.
This article will take you through the following topics:
- How to set up and configure Microsoft Power BI for Office 365
- Connect and access Microsoft Dynamics CRM 2015 datasets
- Explore methods to connect to Dynamics CRM data with Power BI
(For more resources related to this topic, see here.)
Preparation
To build the sales productivity dashboard, we must first have the data and tool sets in place in Microsoft Dynamics CRM 2015 and Microsoft Power BI.
Toward the end of this article, you should be able to set up and use the following environments to get data for your sales productivity dashboard:
- Microsoft Office 365
- Microsoft Dynamics CRM 2015 Online
- Microsoft Power BI for Office 365
After we connect Power BI with Microsoft Dynamics CRM, we will look at the options to load and query the Dynamics CRM sales data using the Power BI Designer.
Setting up Office 365
Before we start building dashboards with Microsoft Power BI, we have a little setup work to do in Microsoft Office 365, Microsoft Power BI sites, and Microsoft Dynamics CRM Online. The good thing is they live inside the Microsoft Office 365 platform. To use these applications, we first need to set up a Microsoft Office 365 instance and user account. Once we establish the Microsoft Office 365 instance, we can access application subscriptions and manage users who use the Microsoft Office 365 Admin Portal.
Here is how it it's done:
- Navigate to Microsoft Office 365 website using the following link:
http://products.office.com/en-us/business/explore-office-365-for-business
- Go to Plans and Pricing and select the plan type that fits your business. There are a few different plans that can be used with Dynamics CRM Online and Power BI, but in this article, we will use the Office 365 Enterprise E3 30-day free trial.
- Once in the Microsoft Office 365 account setup window, enter your company information and create an account. The account provision process will kick off, and you will be logged in to your Microsoft Office 365 Admin Portal shortly after it is provisioned:

The interface as seen after signing in
Adding Dynamics CRM 2015 Online
Now that we have an active Microsoft Office 365 account, we need to add a Dynamics CRM Online subscription.
Dynamics CRM On-Premise deployments will integrate with Power BI using an Internet-facing deployment (IFD) configuration, but in this article, we will use the online version of Dynamics CRM.
To add Dynamics CRM Online to the Office 365 instance, perform the following steps:
- Navigate to Purchase Services in Admin Portal and locate the Microsoft Dynamics CRM subscription offering.
- In this article, we will use the Microsoft Dynamics CRM Online Professional 30-day trial.
Giving user access
Before users can connect to a Dynamics CRM Online instance, a license needs to be assigned to a user account. After you assign this license to the user account, you must also assign a security role so that the user can access your Dynamics CRM Organization. Here is how it's done:
- From the Office 365 Admin Portal, select the Dynamics CRM pane from the list of apps:

- Once in Dynamics CRM, select Setting | Security | Users and then navigate to Users, who need a role assigned:

- Navigate to the user submenu and select MANAGE ROLES:

Once the user role is assigned, you should now see the data in Dynamics CRM:

Data as seen in the Sales Activity Dashboard
Importing the sample data
In this article, we will build datasets for a sales productivity dashboard using data from Dynamics CRM the Lead, Account, Opportunity entities. To add the sample data, download the .csv files and import them into Dynamics CRM Online with the native import tool.
Here is how you import the sample data:
- Download the sample .csv file from ContactLead.csv, Accounts.csv, and Opportunities.csv.
- In Dynamics CRM, open the import tool located under any list view:

- Upload the sample .csv files and begin the import:

- Verify mapping and initiate the import data.
Finding the OData connection
Dynamics CRM is a web-based application built on a set of web services. For this article, we will focus on the Organizational Data Service, using the Protocol OData (REST) protocol to connect Power BI to Dynamics CRM.
Here is how we locate the OData URL in Dynamics CRM to use with Power BI later:
- In Dynamics CRM, select Setting | Customizations in the top navigation bar to access the Customizations area.
- Once in the Customizations area, select Developer Resources and navigate to Organizational Data Service located at the bottom of the browser window:

- In Developer Resources, scroll down to the bottom of the window and copy the OData (REST) URL link. This URL will be used later when you configure the Power BI connection:

Setting up Power BI for the Office 365 site
The new Power BI for Office 365 now includes a secure website portal used to store dashboards, reports, and datasets. We need to set up and configure a new Power BI site.
Here is how it is done:
- Navigate to Microsoft Power BI for the Office 365 website using the following link:
http://www.powerbi.com
- Once in the website, enter the e-mail address that was used when you set up the Office 365 account and then submit a request to Power BI for the Office 365 free trial. Shortly after requesting the trial, you will receive an e-mail with a link to access your Power BI site.
- Once you receive the e-mail, click on the link to the Power BI site and sign in with your specifically created Office 365 user e-mail account.

Sales Productivity Dashboard as seen in Power BI
Unlock access to the largest independent learning library in Tech for FREE!
Get unlimited access to 7500+ expert-authored eBooks and video courses covering every tech area you can think of.
Renews at $15.99/month. Cancel anytime
Installing the Power BI Designer
Power BI along with PowerQuery, PowerMap, and PowerView—used to be only included as a Microsoft Excel 2013 add-in. Although these add-ins are still available, there is now a new tool dedicated to Power BI report and dashboard authoring called Power BI Designer.
The Power BI Designer offers a lot of the same functionalities as its predecessor in Excel add-in, but without the Excel requirements. The benefit of using the Power BI Designer is that it is a standalone program that can provide self-service data connectivity, transformation, modeling, visualizations, and collaboration. The Power BI Designer is a standalone 64-bit application that can be deployed together with a 32-bit version of Office, using the same functionality that was used to create interactive charts, maps, graphs, and data transformations without the requirement of Microsoft Excel 2013.
Here is how you install it:
- In the Power BI site, navigate to the down arrow icon located in the top-right corner of the navigation area:

- Download Power BI Designer Preview.
- Then, install the PBIDesignr_x64.msi file.

- Open Power BI Designer from the desktop icon:

Now that you have Power BI Designer installed and open, you can begin leveraging the tool for dashboard, report creation, and data transformation. Power BI Designer help videos are available at startup or by navigating to File -> Getting Started in the main menu.
The Power BI Designer toolset is based on two views:
- Query: This connects, shapes, and combines data to data models
- Report: This builds reports from the queried information to shareable reports
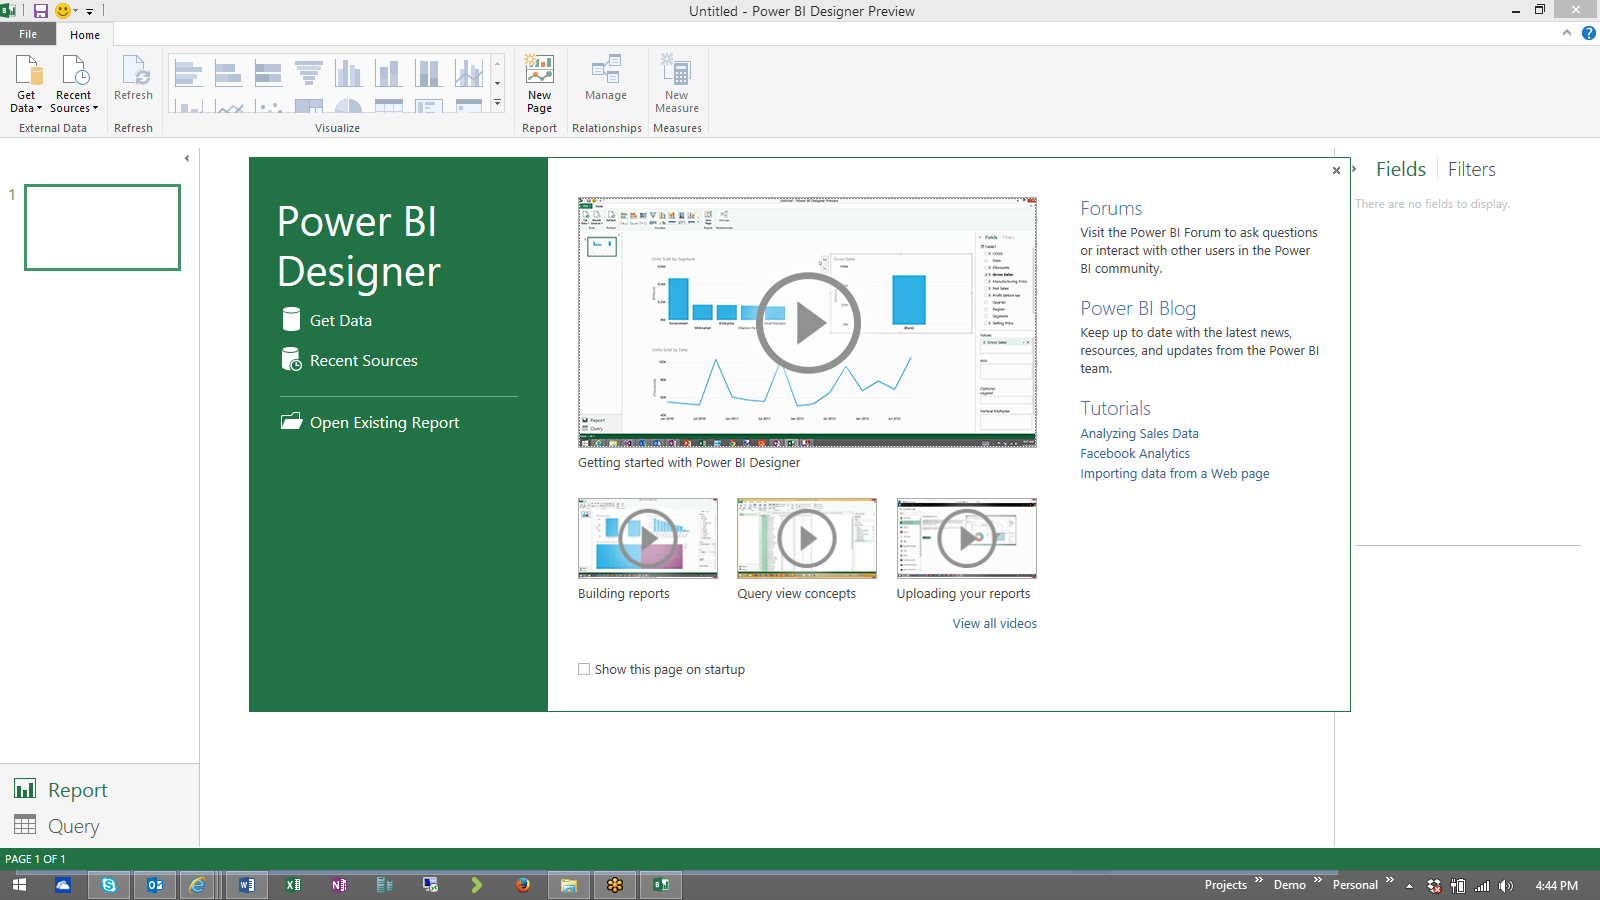
Power BI Designer preview
Once you build your dashboards and reports with Power BI Designer, you will want to save your work. Using Power BI Designer, you can now save it as a Power BI Designer file.
Reviewing authentication methods
Now that the Power BI Designer is installed, we are ready to connect to the Dynamics CRM data and start building our sales productivity dashboards and reports, but before we do this, we need to understand the various OData (REST) authentication methods provided by Power BI.
Each method is briefly explained here:
- Anonymous: This authentication allows any user to access any public content without providing a username and password challenge to the client browser.
- Windows: This authentication occurs when your user runs on a corporate network that uses Microsoft Active Directory service domain identities or other Windows accounts to identify users.
- Basic: This access authentication is a method for an HTTP user agent to provide a username and password when making a request.
- The Web API: This authentication takes place in the host. For web hosting, the host is IIS, which uses HTTP modules for authentication.
- The marketplace key: This authentication is based on the subscription-based account key secured through SSL.
- The Organizational account: This authentication is based on the users of Dynamics CRM Online, cloud applications, or users who run modern LOB applications on-premises that may leverage a web service such as Azure behind the scenes.
Connecting to Dynamics CRM
You just learned how to set up and configure Power BI sites and the Power BI Designer. Now you will learn how to connect the Power BI Designer to the Dynamics CRM Online instance and put data entities into Power BI.
For our sales productivity dashboard, we will use the following Dynamics CRM entities:
- Users
- Leads
- Accounts
- Opportunities
Checking requirements
Before we connect to Dynamic CRM with the Power BI Designer, let's quickly review the general requirements:
- A user must specify a valid OData URL for a Dynamics CRM Online instance. The connector will not work with an on-premise CRM version.
- Enable the OData endpoint in the site settings with Dynamics CRM. Then, select Settings | Customizations | Developer Resources. The OData URL is listed under Service Endpoints.
- The user account that you use to access Dynamics CRM Online must be the same as the one you will use for Power BI.
Accessing data
Earlier, we downloaded and installed the Power BI Designer, which allows read-only access to the Dynamics CRM Online instance in order to make it easy for users to get the sales data they want.
To see how easy it is to access data:
- Open Power BI Designer and select Query from the bottom-left corner of the Power BI Designer window.
- In the top-left corner of the Power BI Designer window, select Get Data.
- In the Get Data Window, select All | Dynamics CRM Online to access the Dynamics CRM Online OData Feed window:

- Once the Microsoft Dynamics CRM Online window opens, enter the Dynamics CRM Online OData (REST) URL previously captured during setup:

The Access Dynamics CRM OnlineOData Feed window may or may not appear to log in to the Dynamics CRM Online instance. If the window does appear, use Organizational account to sign in. For this article, we will select the first URL to connect the OData feed. If the Access Dynamics CRM OnlineOdata Feed window does not appear, you are already connected and authenticated to the Dynamic CRM instance:

Loading data
Once you have successfully connected to your Dynamics CRM organization, the Query functionality of the Power BI Designer runs against the Dynamics CRM Online instance, and the navigator window returns a list of Dynamics CRM data entities to include in your dashboard.
By default, when you load the data to Power BI, all the items will be selected in the navigator window. To individually select multiple items, you will have to check the box to select multiple items.
Here's how you do it:
- Navigate to the top-left corner of the navigator screen and locate the checkbox labeled Select Multiple items.
- Once this checkbox is ticked, the subarea will include additional checkboxes to individually select the Dynamics CRM data entities.
- Select the following items from the navigator window:
- AccountSet
- LeadSet
- OpportunitySet
- SystemUserSet
- The right-hand side of the navigator window will show you a preview of the fields included and data currently in the dataset.
- Select Show Selected to see a queried list of just the dataset selected:

Querying the data
Our next step is to query the Dynamics CRM data that we will load to Power BI. We can do this by editing the query before we load the data or come back later and update the query. By querying only the data we need from Dynamics CRM before loading to Power BI, we can enhance the performance of our reports and dashboards.
Here is how it is done:
- Select Edit Query from the bottom-right hand side of the window; a view of the entity data is presented in Query view:

A view of the entity data
- To modify the query after you load the data, in the top ribbon select View | Show | Query Settings to access the Query Settings pane.
- Select Source in the Query Settings window to update the query entity data:

- In the left-hand side pane, queries are listed and available for selection, viewing, and shaping. In the main pane, data from the selected query is displayed and available for shaping.
Summary
In this article, we looked at how to set up our Office 365, Dynamics CRM, and Power BI environments. We deployed the Power BI Designer and connected Dynamics CRM to Power BI in order to retrieve the sales entity data for our sales productivity dashboard.
Resources for Article:
Further resources on this subject:

 United States
 Great Britain
 India
India
 Germany
 France
 Canada
 Russia
 Spain
Spain
 Brazil
 Australia
 South Africa
 Thailand
 Ukraine
 Switzerland
 Slovakia
 Luxembourg
 Hungary
 Romania
 Denmark
 Ireland
 Estonia
 Belgium
 Italy
Italy
 Finland
 Cyprus
 Lithuania
 Latvia
 Malta
Malta
 Netherlands
 Portugal
 Slovenia
 Sweden
 Argentina
 Colombia
 Ecuador
 Indonesia
 Mexico
 New Zealand
 Norway
 South Korea
 Taiwan
 Turkey
 Czechia
 Austria
 Greece
 Isle of Man
 Bulgaria
 Japan
Japan
 Philippines
 Poland
 Singapore
 Egypt
Egypt
 Chile
Chile
 Malaysia