In this article by Ben Mearns, author of the book QGIS Blueprints, we will take a look at how the raster data can be analyzed, enhanced, and used for map production. Specifically, you will learn to produce a grid of the suitable locations based on the criteria values in other grids using raster analysis and map algebra. Then, using the grid, we will produce a simple click-based map. The end result will be a site suitability web application with click-based discovery capabilities. We'll be looking at the suitability for the farmland preservation selection.
In this article, we will cover the following topics:
- Vector data ETL for raster analysis
- Batch processing
- Leaflet map application publication with QGIS2Leaf
(For more resources related to this topic, see here.)
Vector data Extract, Transform, and Load
Our suitability analysis uses map algebra and criteria grids to give us a single value for the suitability for some activity in every place. This requires that the data be expressed in the raster (grid) format. So, let's perform the other necessary ETL steps and then convert our vector data to raster.
We will perform the following actions:
- Ensure that our data has identical spatial reference systems. For example, we may be using a layer of the roads maintained by the state department of transportation and a layer of land use maintained by the department of natural resources. These layers must have identical spatial reference systems or be transformed to have identical systems.
- Extract geographic objects according to their classes as defined in some attribute table field if we want to operate on them while they're still in the vector form.
- If no further analysis is necessary, convert to raster.
Loading data and establishing the CRS conformity
It is important for the layers in this project to be transformed or projected into the same geographic or projected coordinate system. This is necessary for an accurate analysis and for publication to the web formats. Perform the following steps for this:
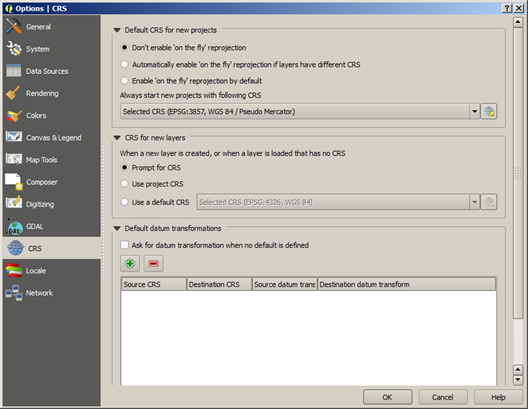
- Disable 'on the fly' projection if it is turned on. Otherwise, 'on the fly' will automatically project your data again to display it with the layers that are already in the Canvas.
- Navigate to Setting | Options and perform the settings shown in the following screenshot:
- Add the project layers:
- Navigate to Layer | Add Layer | Vector Layer.
- Add the following layers from within c2/data.
Applicants
County
Easements
Landuse
Roads
You can select multiple layers to add by pressing Shift and clicking on the contiguous files or pressing Ctrl and clicking on the noncontiguous files.
- Import the Digital Elevation Model from c2/data/dem/dem.tif.
- Navigate to Layer | Add Layer | Raster Layer.
- From the dem directory, select dem.tif and then click on Open.
- Even though the layers are in a different CRS, QGIS does not warn us in this case. You must discover the issue by checking each layer individually. Check the CRS of the county layer and one other layer:
- Highlight the county layer in the Layers panel.
- Navigate to Layer | Properties.
- The CRS is displayed under the General tab in the Coordinate reference system section:

Note that the county layer is in EPSG: 26957, while the others are in EPSG: 2776.
- We will transform the county layer from EPSG:26957 to EPSG:2776.
- Navigate to Layer | Save As | Select CRS.
We will save all the output from this article in c2/output.
To prepare the layers for conversion to raster, we will add a new generic column to all the layers populated with the number 1. This will be translated to a Boolean type raster, where the presence of the object that the raster represents (for example, roads) is indicated by a cell of 1 and all others with a zero. Follow these steps for the applicants, easements, and roads:
- Navigate to Layer | Toggle Editing.
- Then, navigate to Layer | Open Attribute Table.
- Add a column with the button at the top of the Attribute table dialog.
- Use value as the name for the new column and the following data format options:

- Select the new column from the dropdown in the Attribute table and enter 1 into the value box:
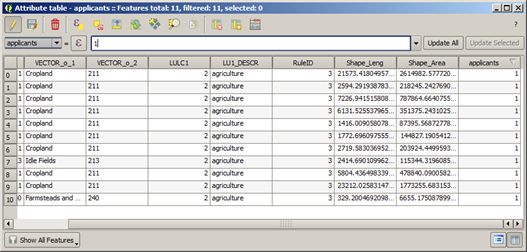
- Click on Update All.
- Navigate to Layer | Toggle Editing.
- Finally, save.
The extracting (filtering) features
Let's suppose that our criteria includes only a subset of the features in our roads layer—major unlimited access roads (but not freeways), a subset of the features as determined by a classification code (CFCC). To temporarily extract this subset, we will do a layer query by performing the following steps:
- Filter the major roads from the roads layer.
- Highlight the roads layer.
- Navigate to Layer | Query.
- Double-click on CFCC to add it to the expression.
- Click on the = operator to add to the expression
- Under the Values section, click on All to view all the unique values in the CFCC field.
- Double-click on A21 to add this to the expression.
- Do this for all the codes less than A36. Include A63 for highway on-ramps.
- You selection code will look similar to this:
"CFCC" = 'A21' OR "CFCC" = 'A25' OR "CFCC" =
 'A31' OR "CFCC" = 'A35' OR "CFCC" = 'A63'
- Click on OK, as shown in the following screenshot:

- Create a new c2/output directory. Save the roads layer as a new layer with only the selected features (major_roads) in this directory.
To clear a layer filter, return to the query dialog on the applied layer (highlight it in the Layers pane; navigate to Layer | Query and click on Clear).
- Repeat these steps for the developed (LULC1 = 1) and agriculture (LULC1 = 2) landuses (separately) from the landuse layer.
Converting to raster
In this section, we will convert all the needed vector layers to raster. We will be doing this in batch, which will allow us to repeat the same operation many times over multiple layers.
Doing more at once—working in batch
The QGIS Processing Framework provides capabilities to run the same operation many times on different data. This is called batch processing. A batch process is invoked from an operation's context menu in the Processing Toolbox. The batch dialog requires that the parameters for each layer be populated for every iteration.
- Convert the vector layers to raster.
- Navigate to Processing Toolbox.
- Select Advanced Interface from the dropdown at the bottom of Processing Toolbox (if it is not selected, it will show as Simple Interface).
- Type rasterize to search for the Rasterize tool.
- Right-click on the Rasterize tool and select Execute as batch process:

- Fill in the Batch Processing dialog, making sure to specify the parameters as follows:
|
Parameter
|
Value
|
|
Input layer
|
(For example, roads)
|
|
Attribute field
Unlock access to the largest independent learning library in Tech for FREE!
Get unlimited access to 7500+ expert-authored eBooks and video courses covering every tech area you can think of.
Renews at €14.99/month. Cancel anytime
|
value
|
|
Output raster size
|
Output resolution in map units per pixel
|
|
Horizontal
|
30
|
|
Vertical
|
30
|
|
Raster type
|
Int16
|
|
Output layer
|
(For example, roads)
|
The following images show how this will look in QGIS:
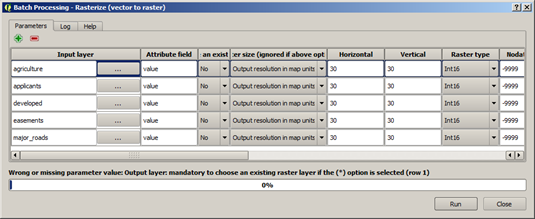
- Scroll to the right to complete the entry of parameter values.

- Organize the new layers (optional step).
- Batch sometimes gives unfriendly names based on some bug in the dialog box.
- Change the layer names by doing the following for each layer created by batch:
- Highlight the layer.
- Navigate to Layer | Properties.
- Change the layer name to the name of the vector layer from which this was created (for example, applicants). You should be able to find a hint for this value in the layer properties in the layer source (name of the .tif file).
- Group the layers.
- Press Shift + click on all the layers created by batch and the previous roads raster.
- Navigate to Right click | Group selected.
Publishing the results as a web application
Now that we have completed our modeling for the site selection of a farmland for conservation, let's take steps to publish this for the Web.
QGIS2leaf
QGIS2leaf allows us to export our QGIS map to web map formats (JavaScript, HTML, and CSS) using the Leaflet map API. Leaflet is a very lightweight, extensible, and responsive (and trendy) web mapping interface.
QGIS2Leaf converts all our vector layers to GeoJSON, which is the most common textual way to express the geographic JavaScript objects. As our operational layer is in GeoJSON, Leaflet's click interaction is supported, and we can access the information in the layers by clicking. It is a fully editable HTML and JavaScript file. You can customize and upload it to an accessible web location.
QGIS2leaf is very simple to use as long as the layers are prepared properly (for example, with respect to CRS) up to this point. It is also very powerful in creating a good starting application including GeoJSON, HTML, and JavaScript for our Leaflet web map.
- Make sure to install the QGIS2Leaf plugin if you haven't already.
- Navigate to Web | QGIS2leaf | Exports a QGIS Project to a working Leaflet webmap.
- Click on the Get Layers button to add the currently displayed layers to the set that QGIS2leaf will export.
- Choose a basemap and enter the additional details if so desired.
- Select Encode to JSON.

These steps will produce a map application similar to the following one. We'll take a look at how to restore the labels:

Summary
In this article, using the site selection example, we covered basic vector data ETL, raster analysis, and web map creation. We started with vector data, and after unifying CRS, we prepared the attribute tables. We then filtered and converted it to raster grids using batch processing. Finally, we published the prepared vector output with QGIS2Leaf as a simple Leaflet web map application with a strong foundation for extension.
Resources for Article:
Further resources on this subject:

 United States
 Great Britain
 India
India
 Germany
 France
 Canada
 Russia
 Spain
Spain
 Brazil
 Australia
 South Africa
 Thailand
 Ukraine
 Switzerland
 Slovakia
 Luxembourg
 Hungary
 Romania
 Denmark
 Ireland
 Estonia
 Belgium
 Italy
Italy
 Finland
 Cyprus
 Lithuania
 Latvia
 Malta
Malta
 Netherlands
 Portugal
 Slovenia
 Sweden
 Argentina
 Colombia
 Ecuador
 Indonesia
 Mexico
 New Zealand
 Norway
 South Korea
 Taiwan
 Turkey
 Czechia
 Austria
 Greece
 Isle of Man
 Bulgaria
 Japan
Japan
 Philippines
 Poland
 Singapore
 Egypt
Egypt
 Chile
Chile
 Malaysia