In this article by Ahmed Sherif, author of the book Practical Business Intelligence, is going to explain what is business intelligence? Before answering this question, I want to pose and answer another question. What isn't business intelligence? It is not spreadsheet analysis done with transactional data with thousands of rows. One of the goals of Business Intelligence or BI is to shield the users of the data from the intelligent logic lurking behind the scenes of the application that is delivering the data to them. If the integrity of the data is compromised in any way by an individual not intimately familiar with the data source, then there cannot, by definition, be intelligence in the business decisions made within that same data. The single source of truth is the key for any Business Intelligence operation whether it is a mom and pop soda shop or a Fortune 500 company. Any report, dashboard, or analytical application that is delivering information to a user through a BI tool but the numbers cannot be tied back to the original source will break the trust between the user and the data and will defeat the purpose of Business Intelligence.
(For more resources related to this topic, see here.)
In my opinion, the most successful tools used for business intelligence directly shield the business user from the query logic used for displaying that same data in some form of visual manner. Business Intelligence has taken many forms in terms of labels over the years.
Business Intelligence is the process of delivering actionable business decisions from analytical manipulation and presentation of data within the confines of a business environment.
The delivery process mentioned in the definition will focus its attention on. The beauty of BI is that it is not owned by any one particular tool that is proprietary to a specific industry or company. Business Intelligence can be delivered using many different tools, some even that were not originally intended to be used for BI. The tool itself should not be the source where the query logic is applied to generate the business logic of the data. The tool should primarily serve as the delivery mechanism of the query that is generated by the data warehouse that houses both the data, as well as the logic.
In this chapter we will cover the following topics:
- Understanding the Kimball method
- Understanding business intelligence
- Data and SQL
- Working with data and SQL
- Working with business intelligence tools
- Downloading and installing MS SQL Server 2014
- Downloading and installing AdventureWorks
Understanding the Kimball method
As we discuss the data warehouse where our data is being housed, we will be remised not to bring up Ralph Kimball, one of the original architects of the data warehouse. Kimball's methodology incorporated dimensional modeling, which has become the standard for modeling a data warehouse for Business Intelligence purposes. Dimensional modeling incorporates joining tables that have detail data and tables that have lookup data.
A detail table is known as a fact table in dimensional modeling. An example of a fact table would be a table holding thousands of rows of transactional sales from a retail store. The table will house several ID's affiliated with the product, the sales person, the purchase date, and the purchaser just to name a few. Additionally, the fact table will store numeric data for each individual transaction, such as sales quantity for sales amount to name a few examples. These numeric values will be referred to as measures.
While there is usually one fact table, there will also be several lookup or dimensional tables that will have one table for each ID that is used in a fact table. So, for example, there would be one dimensional table for the product name affiliated with a product ID. There would be one dimensional table for the month, week, day, and year of the id affiliated with the date. These dimensional tables are also referred to as Lookup Tables, because they kind of look up what the name of a dimension ID is affiliated with. Usually, you would find as many dimensional tables as there are ID's in the fact table. The dimensional tables would all be joined to the one fact table creating something of a 'star' look. Hence, the name for this type of table join is known as a star schema which is represented diagrammatically in the following figure.

It is customary that the fact table will be the largest table in a data warehouse while the lookup tables will all be quite small in rows, some as small as one row. The tables are joined by ID's, also known as surrogate keys. Surrogate keys allow for the most efficient join between a fact table and a dimensional table as they are usually a data type of integer. As more and more detail is added to a dimensional table, that new dimension is just given the next number in line, usually starting with 1. Query performance between tables joins suffers when we introduce non-numeric characters into the join or worse, symbols (although most databases will not allow that).
Understanding business intelligence architecture
I will continuously hammer home the point that the various tools utilized to deliver the visual and graphical BI components should not house any internal logic to filter data out of the tool nor should it be the source of any built in calculations. The tools themselves should not house this logic as they will be utilized by many different users. If each user who develops a BI app off of the tool incorporates different internal filters without the tool, the single source of truth tying back to the data warehouse will become multiple sources of truths.
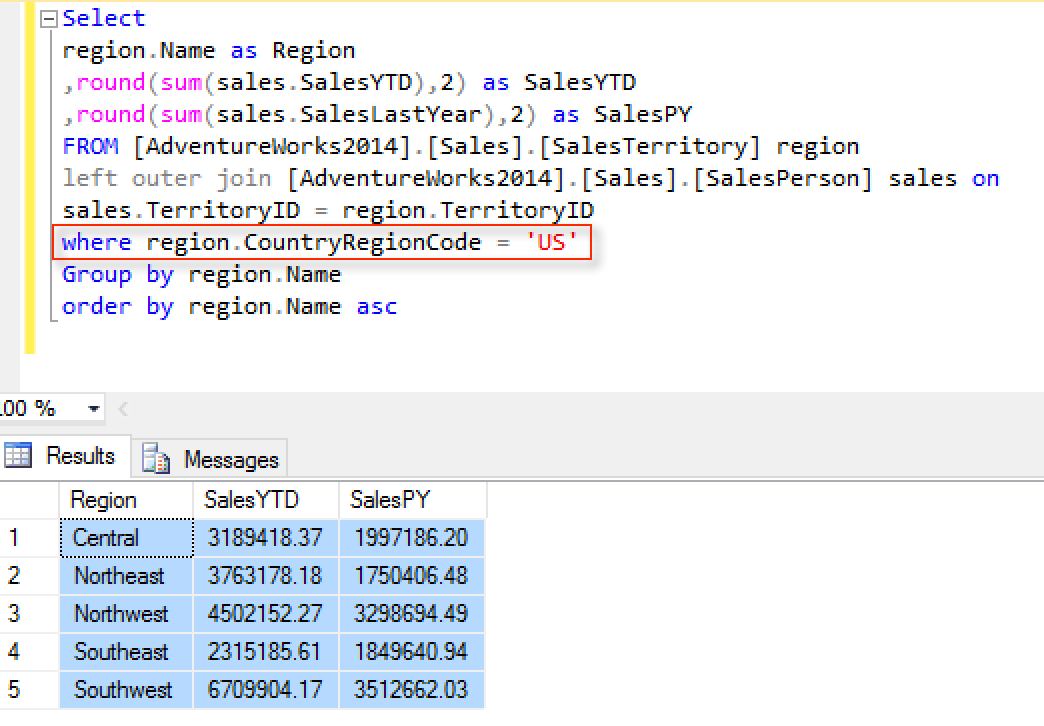
Any logic applied to the data to filter out a specific dimension or to calculate a specific measure should be applied in the data warehouse and then pulled into the tool. For example, if the requirement for a BI dashboard was to show current year and prior year sales for US regions only, the filter for region code would be ideally applied in the data warehouse as opposed to inside of the tool. The following is a query written in SQL joining two tables from the AdventureWorks database that highlights the difference between dimenions and measures. The 'region' column is a dimension column and the 'SalesYTD' and 'SalesPY' are measure columns.
In this example, the 'TerritoryID' is serving as the key join between 'SalesTerritory' and 'SalesPerson'. Since the measures are coming from the 'SalesPerson' table, that table will serve as the fact table and 'SalesPerson.TerritoryID' will serve as the fact ID. Since the Region column is dimensional and coming from the 'SalesTerritory' table, that table will serve as the dimensional or lookup table and 'SalesTerritory.TerritoryID' will serve as the dimension ID. In a finely-tuned data warehouse both the fact ID and dimension ID would be indexed to allow for efficient query performance. This performance is obtained by sorting the ID's numerically so that a row from one table that is being joined to another table does not have to be searched through the entire table but only a subset of that table. When the table is only a few hundred rows, it may not seem necessary to index columns, but when the table grows to a few hundred million rows, it may become necessary.
Select
region.Name as Region
,round(sum(sales.SalesYTD),2) as SalesYTD
,round(sum(sales.SalesLastYear),2) as SalesPY
FROM [AdventureWorks2014].[Sales].[SalesTerritory] region
left outer join [AdventureWorks2014].[Sales].[SalesPerson] sales on
sales.TerritoryID = region.TerritoryID
where region.CountryRegionCode = 'US'
Group by region.Name
order by region.Name asc
There are several reasons why applying the logic at the database level is considered a best practice. Most of the time, these requests for filtering data or manipulating calculations are done at the BI tool level because it is easier for the developer than to go to the source. However, if these filters are being performed due to data quality issues then applying logic at the reporting level is only masking an underlying data issue that needs to be addressed across the entire data warehouse. You would be doing yourself a disservice in the long run as you will be establishing a precedence that the data quality would be handled by the report developer as opposed to the database administrator. You are just adding additional work onto your plate.
Ideal BI tools will quickly connect to the data source and then allow for slicing and dicing of your dimensions and measures in a manner that will quickly inform the business of useful and practical information. Ultimately, the choice of a BI tool by an individual or an organization will come down to the ease of use of the tool as well as the flexibility to showcase the data through various components such as graphs, charts, widgets, and infographics.
Management
If you are a Business Intelligence manager looking to establish a department with a variety of tools to help flesh out your requirements, could serve as a good source for interview questions to weed out unqualified candidates. A manager could use to distinguish some of the nuances between these different skillsets and prioritize hiring based on immediate needs.
Data Scientist
The term Data Scientist has been misused in the BI industry, in my humble opinion. It has been lumped in with Data Analyst as well as BI Developer. Unfortunately, these three positions have separate skillsets and you will do yourself a disservice by assuming one person can do multiple positions successfully. A Data Scientist will be able to apply statistical algorithms behind the data that is being extracted from the BI tools and make predictions about what will happen in the future with that same data set. Due to this skillset, a Data Scientist may find the chapters focusing on R and Python to be of particular importance because of their abilities to leverage predictive capabilities within their BI delivery mechanisms.
Data Analyst
A Data Analyst is probably the second most misused position behind a Data Scientist. Typically, a Data Analyst should be analyzing the data that is coming out of the BI tools that are connected to the data warehouse. Most Data Analysts are comfortable working with Microsoft Excel. Often times they are asked to take on additional roles in developing dashboards that require additional programming skills. This is where they would find some comfort using a tool like Power BI, Tableau, or QlikView. These tools would allow for a Data Analyst to quickly develop a storyboard or visualization that would allow for quick analysis with minimal programming skills.
Visualization Developer
A 'dataviz' developer is someone who can create complex visualizations out of data and showcase interesting interactions between different measures inside of a dataset that cannot necessarily be seen with a traditional chart or graph. More often than not these developers possess some programming background such as JavaScript, HTML, or CSS. These developers are also used to developing applications directly for the web and therefore would find D3.js a comfortable environment to program in.

Working with Data and SQL
The examples and exercises that will come from the AdventureWorks database. The AdventureWorks database has a comprehensive list of tables that mimics an actual bicycle retailor. The examples will draw on different tables from the database to highlight BI reporting from the various segments appropriate for the AdventureWorks Company. These segments include Human Resources, Manufacturing, Sales, Purchasing, and Contact Management. A different segment of the data will be highlighted in each chapter utilizing a specific set of tools. A cursory understanding of SQL (structured query language) will be helpful to get a grasp of how data is being aggregated with dimensions and measures. Additionally, an understanding of the SQL statements used will help with the validation process to ensure a single source of truth between the source data and the output inside of the BI tool of choice.
For more information about learning SQL, visit the following website: www.sqlfordummies.com
Working with business intelligence tools
Over the course of the last 20 years, there have been a growing number of software products released that were geared towards Business Intelligence. In addition, there have been a number of software products and programming languages that were not initially built for BI but later on became a staple for the industry. The tools used were chosen based on the fact that they were either built off of open source technology or they were products from companies that provided free versions of their software for development purposes. Many companies from the big enterprise firms have their own BI tools and they are quite popular. However, unless you have a license with them, it is unlikely that you will be able to use their tool without having to shell out a small fortune.
Power BI and Excel
Power BI is one of the more relatively newer BI tools from Microsoft. It is known as a self-service solution and integrates seamlessly with other data sources such as Microsoft Excel and Microsoft SQL Server. Our primary purpose in using Power BI will be to generate interactive dashboards, reports, and datasets for users.
In addition to using Power BI we will also focus on utilizing Microsoft Excel to assist with some data analysis and validation of results that are being pulled from our data warehouse. Pivot tables are very popular within MS Excel and will be used to validate aggregation done inside of the data warehouse.

D3.js
D3.js, also known as data-driven documents, is a JavaScript library known for delivery beautiful visualizations by manipulating documents based on data. Since D3 is rooted in JavaScript, all visualizations make a seamless transition to the web. D3 allows for major customization to any part of visualization and because of this flexibility, it will require a steeper learning curve that probably any other software program. D3 can consume data easily as a .json or a .csv file. Additionally, the data can also be imbedded directly within the JavaScript code that renders the visualization on the web.

R
R is a free and open source statistical programming language that produces beautiful graphics. The R language has been widely used among the statistical community and more recently in the data science and machine learning community as well. Due to this fact, it has picked up steam in recent years as a platform for displaying and delivering effective and practical BI. In addition to visualizing BI, R has the ability to also visualize predictive analysis with algorithms and forecasts. While R is a bit raw in its interface, there have been some IDE's (Integrated Development Environment) that have been developed to ease the user experience. RStudio will be used to deliver the visualisations developed within R.

Python
Python is considered the most traditional programming language of all the different languages. It is a widely used general purpose programming language with several modules that are very powerful in analysing and visualizing data. Similar to R, Python is a bit raw in its own form for delivering beautiful graphics as a BI tool; however, with the incorporation of an IDE the user interface becomes much more of a pleasurable development experience. PyCharm will be the IDE used to develop BI with Python. PyCharm is free to use and allows creation of the iPython notebook which delivers seamless integration between Python and the powerful modules that will assist with BI.
As a note, all code in Python will be developed using the Python 3 syntax.

QlikView
QlikView is a software company specializing in delivering business intelligence solutions using their desktop tool. QlikView is one of the leaders in delivering quick visualizations based on data and queries through their desktop application. They advertise themselves to be self-service BI for business users. While they do offer solutions that target more enterprise organizations, they also offer a free version of their tool for personal use. Tableau is probably the closest competitor in terms of delivering similar BI solutions.

Tableau
Tableau is a software company specializing in delivering business intelligence solutions using their desktop tool. If this sounds familiar to QlikView, it's probably because it's true. Both are leaders in the field of establishing a delivery mechanism with easy installation, setup, and connectivity to the available data. Tableau has a free version of their desktop tool. Again, Tableau excels at delivering both beautiful visualizations quickly as well as self-service data discovery to more advanced business users.

Microsoft SQL Server
Microsoft SQL will serve as the data warehouse for the examples that we will with the BI Tools. Microsoft SQL Server is relatively simple to install and set up as well it is free to download. Additionally, there are example databases that configure seamlessly with it, such as the AdventureWorks database.

Downloading and Installing MS SQL Server 2014
First things first. We will need to get started with getting our database and data warehouse up and running so that we can begin to develop our BI environment.
We will visit the Microsoft website below to start the download selection process.
https://www.microsoft.com/en-us/download/details.aspx?id=42299
Unlock access to the largest independent learning library in Tech for FREE!
Get unlimited access to 7500+ expert-authored eBooks and video courses covering every tech area you can think of.
Renews at €14.99/month. Cancel anytime
Select the specified language that is applicable to you and also select the MS SQL Server Express version with Advanced features that is 64-bit edition as shown in the following screenshot. Ideally you'll want to be working in a 64-bit edition when dealing with servers.
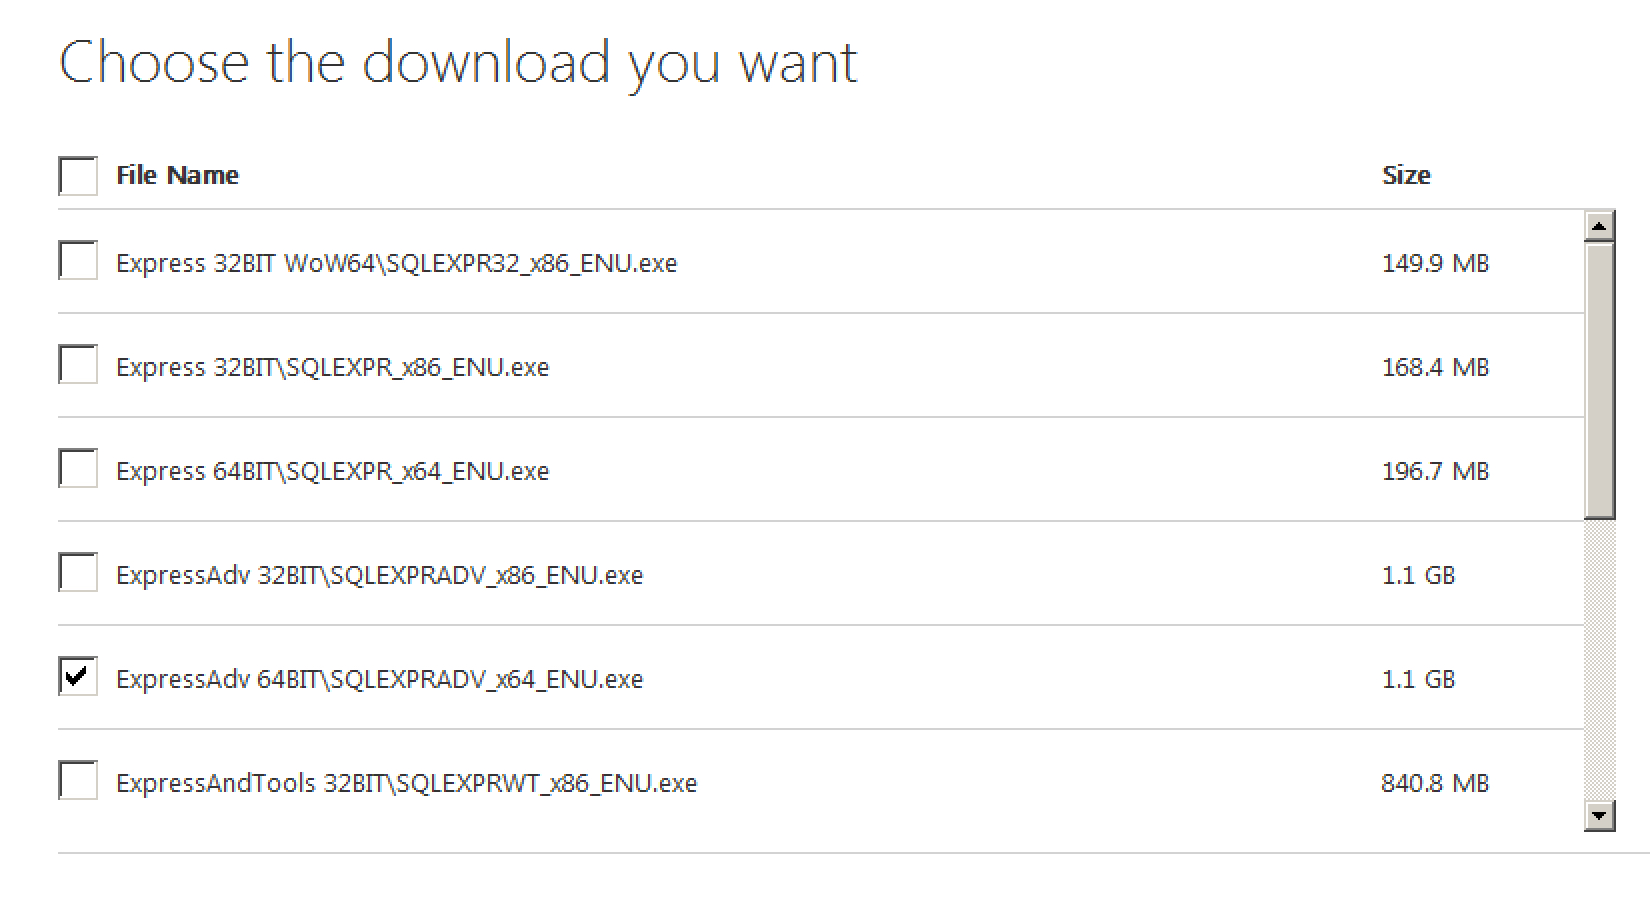
After selecting the file, the download process should begin. Depending on your connection speed it could take some time as the file is slightly larger than 1 GB.
The next step in the process is selecting a new stand-alone instance of SQL Server 2014 unless you already have a version and wish to upgrade instead as shown in the following screenshot..

After accepting the license terms, continue through the steps in the Global Rules as well as the Product Updates to get to the setup installation files.
For the feature selection tab, make sure the following features are selected for your installation as shown in the following screenshot.

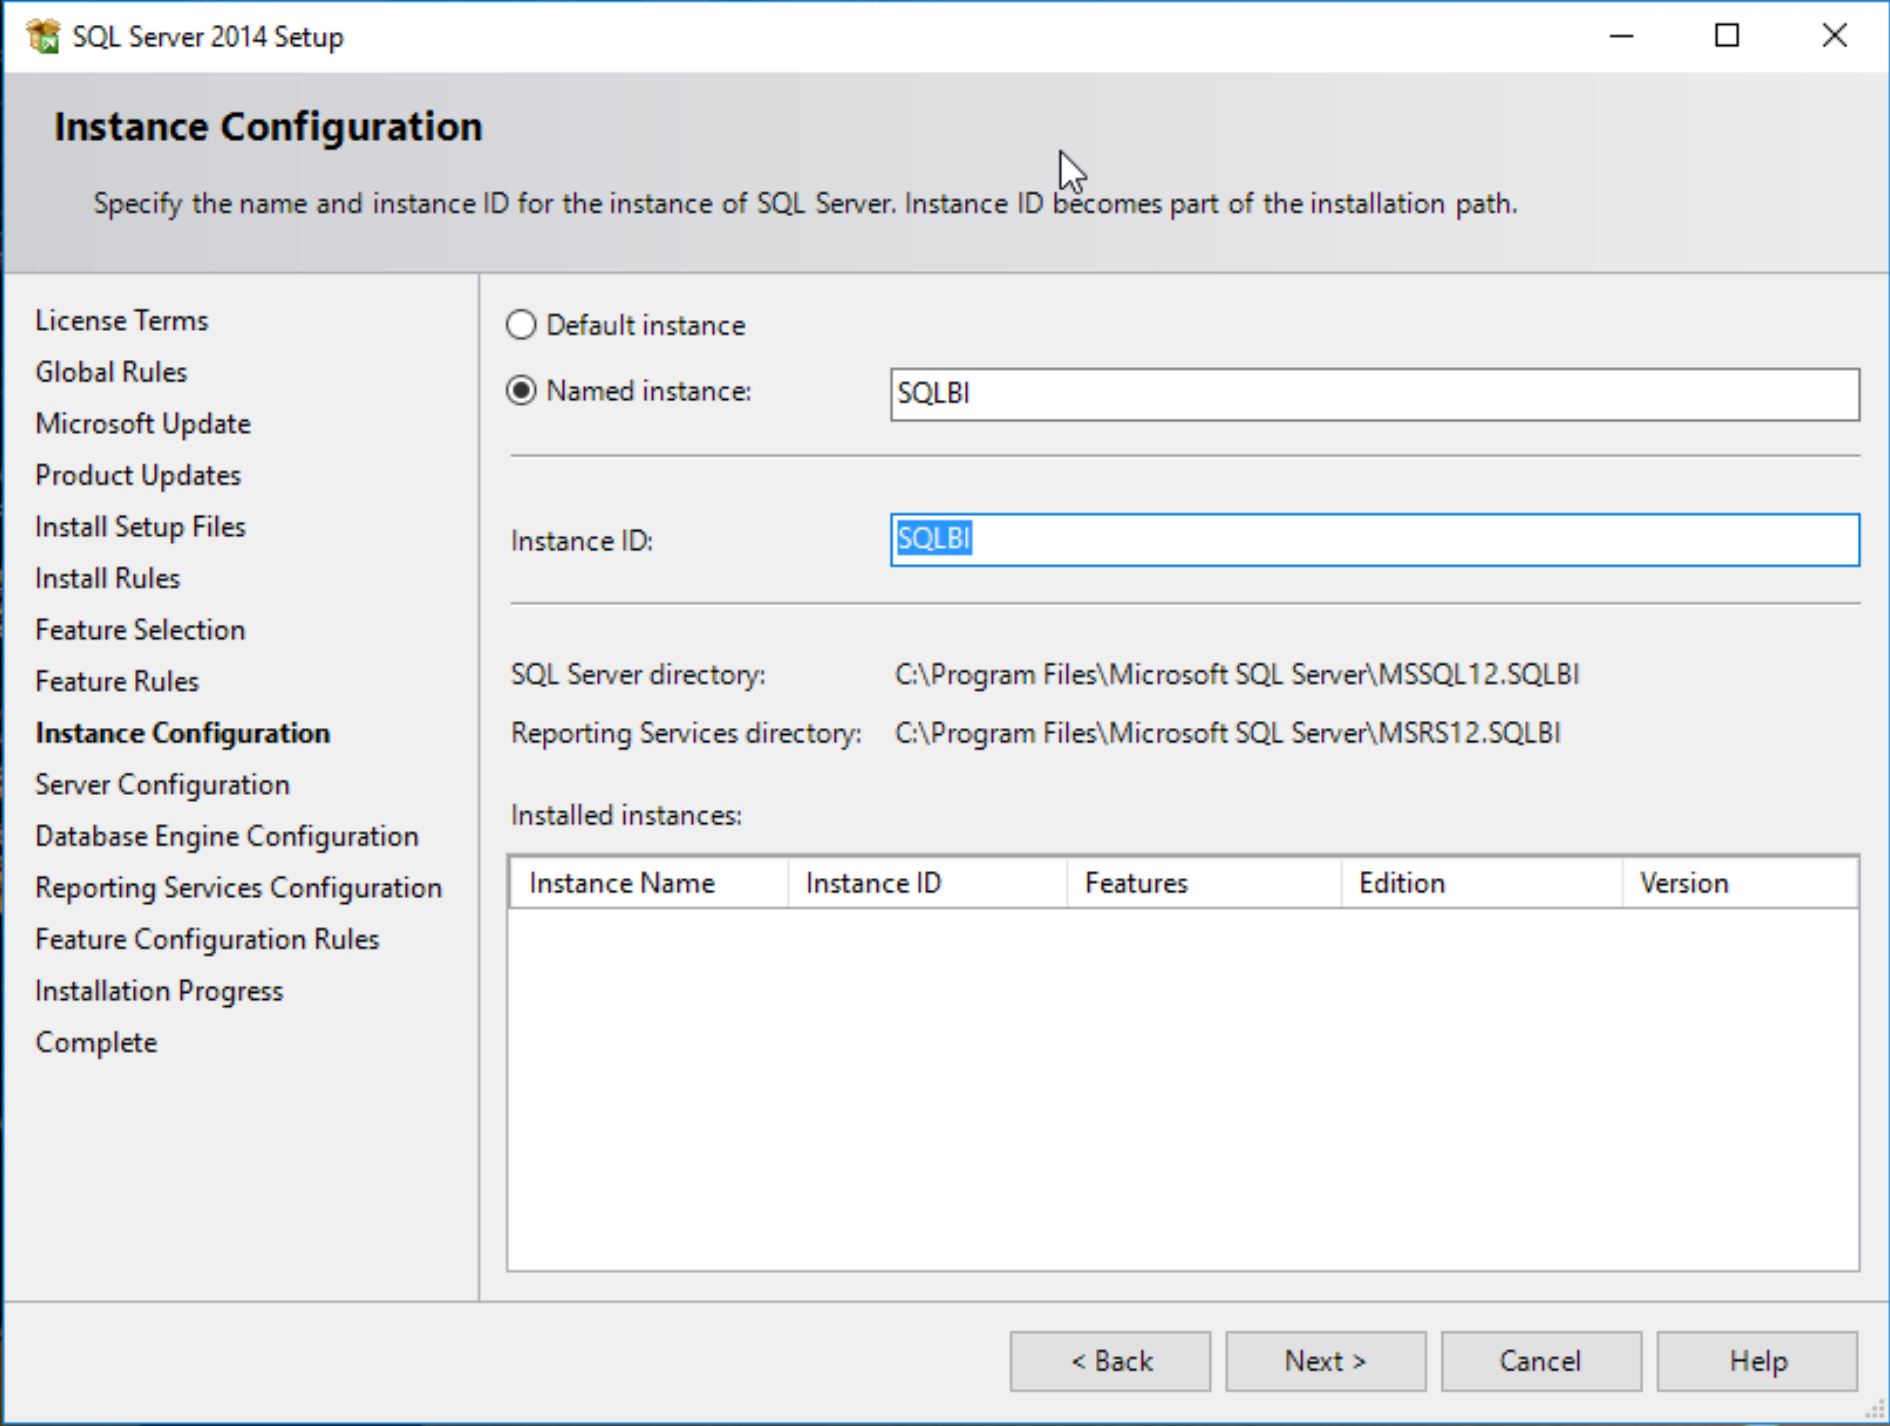
Our preference is to label a named instance of this database to something related to the work we are doing. Since this will be used for Business Intelligence, I went ahead and name this instance 'SQLBI' as shown in the following screenshot:
The default Server Configuration settings are sufficient for now, there is no need to change anything under that section as shown in the following screenshot.

Unless you are required to do so within your company or organization, for personal use it is sufficient to just go with Windows Authentication mode for sign-on as shown in the following screenshot.

We will not need to do any configuring of reporting services, so it is sufficient for our purposes to just with installing Reporting Services Native mode without any need for configuration at this time.
At this point the installation will proceed and may take anywhere between 20-30 minutes depending on the cpu resources.
If you continue to have issues with your installation, you can visit the following website from Microsoft for additional help.
http://social.technet.microsoft.com/wiki/contents/articles/23878.installing-sql-server-2014-step-by-step-tutorial.aspx
Ultimately, if everything with the installation is successful, you'll want to see all portions of the installation have a green check mark next to their name and be labeled 'Successful' as shown in the following screenshot.

Downloading and Installing AdventureWorks
We are almost finished with getting our business intelligence data warehouse complete. We are now at the stage where we will extract and load data into our data warehouse. The last part is to download and install the AdventureWorks database from Microsoft. The zipped file for AdventureWorks 2014 is located in the following website from Microsoft:
https://msftdbprodsamples.codeplex.com/downloads/get/880661
Once the file is downloaded and unzipped, you will find a file named the following: AdventureWorks2014.bak
Copy that file and paste it in the following folder where it will be incorporated with your Microsoft SQL Server 2014 Express Edition.
C:Program FilesMicrosoft SQL ServerMSSQL12.SQLBIMSSQLBackup
Also note that the MSSQL12.SQLBI subfolder will vary user by user depending on what you named your SQL instance when you were installing MS SQL Server 2014.
Once that has been copied over, we can fire up Management Studio for SQL Server 2014 and start up a blank new query by going to
- File
- New
- Query with Current Connection
Once you have a blank query set up, copy and paste the following code in the and execute it:
use [master]
Restore database AdventureWorks2014

from disk = 'C:Program FilesMicrosoft SQL ServerMSSQL12.SQLBIMSSQLBackupAdventureWorks2014.bak'

with move 'AdventureWorks2014_data'

to 'C:Program FilesMicrosoft SQL ServerMSSQL12.SQLBIMSSQLDATAAdventureWorks2014.mdf',

Move 'AdventureWorks2014_log'

to 'C:Program FilesMicrosoft SQL ServerMSSQL12.SQLBIMSSQLDATAAdventureWorks2014.ldf'
, replace
Once again, please note that the MSSQL12.SQLBI subfolder will vary user by user depending on what you named your SQL instance when you were installing MS SQL Server 2014.
At this point in time within the database you should have received a message saying that Microsoft SQL Server has processed 24248 pages for database 'AdventureWorks2014'. Once you have refreshed your database tab on the upper left hand corner of SQL Server, the AdventureWorks database will become visible as well as all of the appropriate tables as shown in the following screenshot:

One final step that we will need to verify just to make sure that your login account has all of the appropriate server settings. When you right-click on the SQL Server name on the upper left hand portion of Management Studio, select the properties.
Select Permissions inside Properties.
Find your username and check all of the rights under the Grant column as shown in the following screenshot:

Finally, we need to also ensure that the folder that houses Microsoft SQL Server 2014 also has the appropriate rights enabled for your current user. That specific folder is located under C:Program FilesMicrosoft SQL Server.
For purposes of our exercises, we will assign all rights for the SQL Server user to the following folder as shown in the following screenshot:

We are now ready to begin connecting our BI tools to our data!
Summary
The emphasis will be placed on implementing Business Intelligence best practices within the various tools that will be used based on the different levels of data that is provided within the AdventureWorks database.
In the next chapter we will cover extracting additional data from the web that will be joined to the AdventureWorks database. This process is known as web scraping and can be performed with great success using tools such as Python and R. In addition to collecting the data, we will focus on transforming the collected data for optimal query performance.
Resources for Article:
Further resources on this subject:

 United States
 Great Britain
 India
India
 Germany
 France
 Canada
 Russia
 Spain
Spain
 Brazil
 Australia
 South Africa
 Thailand
 Ukraine
 Switzerland
 Slovakia
 Luxembourg
 Hungary
 Romania
 Denmark
 Ireland
 Estonia
 Belgium
 Italy
Italy
 Finland
 Cyprus
 Lithuania
 Latvia
 Malta
Malta
 Netherlands
 Portugal
 Slovenia
 Sweden
 Argentina
 Colombia
 Ecuador
 Indonesia
 Mexico
 New Zealand
 Norway
 South Korea
 Taiwan
 Turkey
 Czechia
 Austria
 Greece
 Isle of Man
 Bulgaria
 Japan
Japan
 Philippines
 Poland
 Singapore
 Egypt
Egypt
 Chile
Chile
 Malaysia


