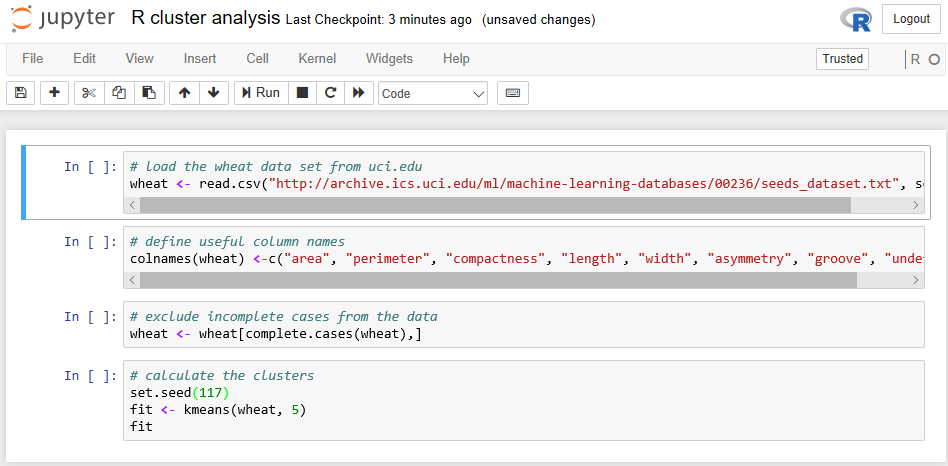
R cluster analysis
In this example, we will use R's cluster analysis functions to determine the clustering in the wheat dataset from https://uci.edu/.
The R script we want to use in Jupyter is as follows:
# load the wheat data set from uci.edu
wheat <- read.csv("http://archive.ics.uci.edu/ml/machine-learning-databases/00236/seeds_dataset.txt", sep="\t")
# define useful column names
colnames(wheat) <-c("area", "perimeter", "compactness", "length", "width", "asymmetry", "groove", "undefined")
# exclude incomplete cases from the data
wheat <- wheat[complete.cases(wheat),]
# calculate the clusters
set.seed(117) #to make reproducible results
fit <- kmeans(wheat, 5)
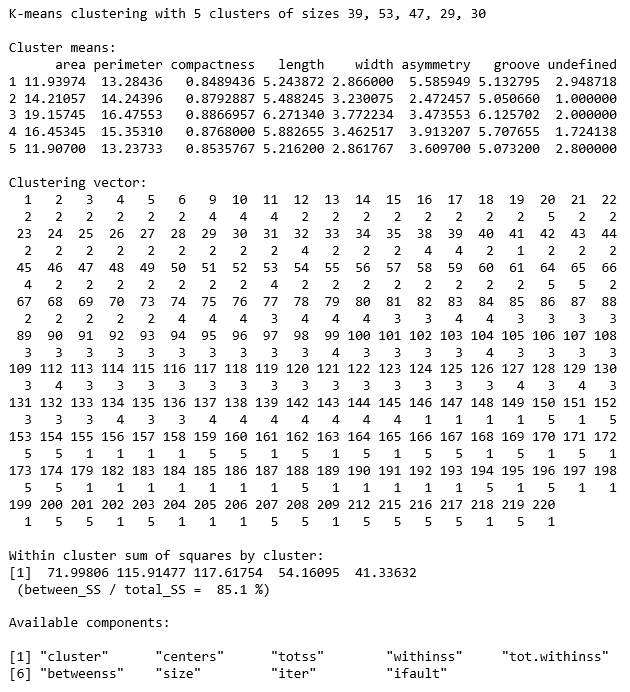
fit Once entered into a Notebook, we will have something such as this:
The resulting, generated cluster information is k-means clustering with five clusters of sizes; 39, 53, 47, 29, and 30 (Note that I set the seed value for random number use, so your results will not vary):
So, we generated the information...