In this article by Vincent Bumgarner & James D. Miller, author of the book, Implementing Splunk - Second Edition, we will walk through the most common elements in the Splunk interface, and will touch upon concepts that will be covered in greater detail. You may want to dive right into the search section, but an overview of the user interface elements might save you some frustration later. We will cover the following topics:
- Logging in and app selection
- A detailed explanation of the search interface widgets
- A quick overview of the admin interface
(For more resources related to this topic, see here.)
Logging into Splunk
The Splunk GUI interface (Splunk is also accessible through its command-line interface [CLI] and REST API) is web-based, which means that no client needs to be installed. Newer browsers with fast JavaScript engines, such as Chrome, Firefox, and Safari, work better with the interface. As of Splunk Version 6.2.0, no browser extensions are required. Splunk Versions 4.2 and earlier require Flash to render graphs. Flash can still be used by older browsers, or for older apps that reference Flash explicitly. The default port for a Splunk installation is 8000.
The address will look like: http://mysplunkserver:8000 or http://mysplunkserver.mycompany.com:8000.

The Splunk interface
If you have installed Splunk on your local machine, the address can be some variant of http://localhost:8000, http://127.0.0.1:8000, http://machinename:8000, or http://machinename.local:8000.
Once you determine the address, the first page you will see is the login screen. The default username is admin with the password changeme. The first time you log in, you will be prompted to change the password for the admin user. It is a good idea to change this password to prevent unwanted changes to your deployment.
By default, accounts are configured and stored within Splunk. Authentication can be configured to use another system, for instance Lightweight Directory Access Protocol (LDAP). By default, Splunk authenticates locally. If LDAP is set up, the order is as follows: LDAP / Local.
The home app
After logging in, the default app is the Launcher app (some may refer to this as Home). This app is a launching pad for apps and tutorials.

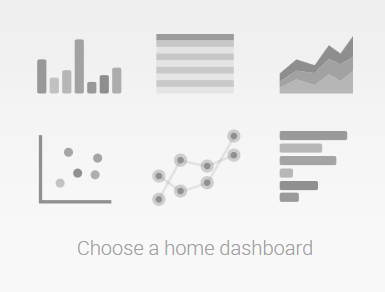
In earlier versions of Splunk, the Welcome tab provided two important shortcuts, Add data and the Launch search app. In version 6.2.0, the Home app is divided into distinct areas, or panes, that provide easy access to Explore Splunk Enterprise (Add Data, Splunk Apps, Splunk Docs, and Splunk Answers) as well as Apps (the App management page) Search & Reporting (the link to the Search app), and an area where you can set your default dashboard (choose a home dashboard).

The Explore Splunk Enterprise pane shows links to:
- Add data: This links Add Data to the Splunk page. This interface is a great start for getting local data flowing into Splunk (making it available to Splunk users). The Preview data interface takes an enormous amount of complexity out of configuring dates and line breaking.
- Splunk Apps: This allows you to find and install more apps from the Splunk Apps Marketplace (http://apps.splunk.com). This marketplace is a useful resource where Splunk users and employees post Splunk apps, mostly free but some premium ones as well.
- Splunk Answers: This is one of your links to the wide amount of Splunk documentation available, specifically http://answers.splunk.com, where you can engage with the Splunk community on Splunkbase (https://splunkbase.splunk.com/) and learn how to get the most out of your Splunk deployment.

The Apps section shows the apps that have GUI elements on your instance of Splunk. App is an overloaded term in Splunk. An app doesn't necessarily have a GUI at all; it is simply a collection of configurations wrapped into a directory structure that means something to Splunk.

Search & Reporting is the link to the Splunk Search & Reporting app.

Beneath the Search & Reporting link, Splunk provides an outline which, when you hover over it, displays a Find More Apps balloon tip. Clicking on the link opens the same Browse more apps page as the Splunk Apps link mentioned earlier.

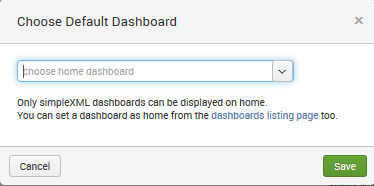
Choose a home dashboard provides an intuitive way to select an existing (simple XML) dashboard and set it as part of your Splunk Welcome or Home page. This sets you at a familiar starting point each time you enter Splunk. The following image displays the Choose Default Dashboard dialog:

Once you select an existing dashboard from the dropdown list, it will be part of your welcome screen every time you log into Splunk – until you change it. There are no dashboards installed by default after installing Splunk, except the Search & Reporting app. Once you have created additional dashboards, they can be selected as the default.
The top bar
The bar across the top of the window contains information about where you are, as well as quick links to preferences, other apps, and administration.
The current app is specified in the upper-left corner. The following image shows the upper-left Splunk bar when using the Search & Reporting app:

Clicking on the text takes you to the default page for that app. In most apps, the text next to the logo is simply changed, but the whole block can be customized with logos and alternate text by modifying the app's CSS.

The upper-right corner of the window, as seen in the previous image, contains action links that are almost always available:
The search & reporting app
The Search & Reporting app (or just the search app) is where most actions in Splunk start. This app is a dashboard where you will begin your searching.
The summary view
Within the Search & Reporting app, the user is presented with the Summary view, which contains information about the data which that user searches for by default. This is an important distinction—in a mature Splunk installation, not all users will always search all data by default. But at first, if this is your first trip into Search & Reporting, you'll see the following:

From the screen depicted in the previous screenshot, you can access the Splunk documentation related to What to Search and How to Search. Once you have at least some data indexed, Splunk will provide some statistics on the available data under What to Search (remember that this reflects only the indexes that this particular user searches by default; there are other events that are indexed by Splunk, including events that Splunk indexes about itself.) This is seen in the following image:

In previous versions of Splunk, panels such as the All indexed data panel provided statistics for a user's indexed data. Other panels gave a breakdown of data using three important pieces of metadata—Source, Sourcetype, and Hosts. In the current version—6.2.0—you access this information by clicking on the button labeled Data Summary, which presents the following to the user:

This dialog splits the information into three tabs—Hosts, Sources and Sourcetypes.
- A host is a captured hostname for an event. In the majority of cases, the host field is set to the name of the machine where the data originated. There are cases where this is not known, so the host can also be configured arbitrarily.
- A source in Splunk is a unique path or name. In a large installation, there may be thousands of machines submitting data, but all data on the same path across these machines counts as one source. When the data source is not a file, the value of the source can be arbitrary, for instance, the name of a script or network port.
- A source type is an arbitrary categorization of events. There may be many sources across many hosts, in the same source type. For instance, given the sources /var/log/access.2012-03-01.log and /var/log/access.2012-03-02.log on the hosts fred and wilma, you could reference all these logs with source type access or any other name that you like.
Let's move on now and discuss each of the Splunk widgets (just below the app name). The first widget is the navigation bar.
Unlock access to the largest independent learning library in Tech for FREE!
Get unlimited access to 7500+ expert-authored eBooks and video courses covering every tech area you can think of.
Renews at €14.99/month. Cancel anytime

As a general rule, within Splunk, items with downward triangles are menus. Items without a downward triangle are links.
Next we find the Search bar. This is where the magic starts. We'll go into great detail shortly.

Search
Okay, we've finally made it to search. This is where the real power of Splunk lies.
For our first search, we will search for the word (not case specific); error. Click in the search bar, type the word error, and then either press Enter or click on the magnifying glass to the right of the bar.

Upon initiating the search, we are taken to the search results page.

Note that the search we just executed was across All time (by default); to change the search time, you can utilize the Splunk time picker.
Actions
Let's inspect the elements on this page. Below the Search bar, we have the event count, action icons, and menus.

Starting from the left, we have the following:
- The number of events matched by the base search. Technically, this may not be the number of results pulled from disk, depending on your search. Also, if your query uses commands, this number may not match what is shown in the event listing.
- Job: This opens the Search job inspector window, which provides very detailed information about the query that was run.
- Pause: This causes the current search to stop locating events but keeps the job open. This is useful if you want to inspect the current results to determine whether you want to continue a long running search.
- Stop: This stops the execution of the current search but keeps the results generated so far. This is useful when you have found enough and want to inspect or share the results found so far.
- Share: This shares the search job. This option extends the job's lifetime to seven days and sets the read permissions to everyone.
- Export: This exports the results. Select this option to output to CSV, raw events, XML, or JavaScript Object Notation (JSON) and specify the number of results to export.
- Print: This formats the page for printing and instructs the browser to print.
- Smart Mode: This controls the search experience. You can set it to speed up searches by cutting down on the event data it returns and, additionally, by reducing the number of fields that Splunk will extract by default from the data (Fast mode). You can, otherwise, set it to return as much event information as possible (Verbose mode). In Smart mode (the default setting) it toggles search behavior based on the type of search you're running.
Timeline
Now we'll skip to the timeline below the action icons.

Along with providing a quick overview of the event distribution over a period of time, the timeline is also a very useful tool for selecting sections of time. Placing the pointer over the timeline displays a pop-up for the number of events in that slice of time. Clicking on the timeline selects the events for a particular slice of time.
Clicking and dragging selects a range of time.

Once you have selected a period of time, clicking on Zoom to selection changes the time frame and reruns the search for that specific slice of time. Repeating this process is an effective way to drill down to specific events.
Deselect shows all events for the time range selected in the time picker.
Zoom out changes the window of time to a larger period around the events in the current time frame
The field picker
To the left of the search results, we find the field picker. This is a great tool for discovering patterns and filtering search results.

Fields
The field list contains two lists:
- Selected Fields, which have their values displayed under the search event in the search results
- Interesting Fields, which are other fields that Splunk has picked out for you
Above the field list are two links: Hide Fields and All Fields.
- Hide Fields: Hides the field list area from view.
- All Fields: Takes you to the Selected Fields window.

Search results
We are almost through with all the widgets on the page. We still have a number of items to cover in the search results section though, just to be thorough.

As you can see in the previous screenshot, at the top of this section, we have the number of events displayed. When viewing all results in their raw form, this number will match the number above the timeline. This value can be changed either by making a selection on the timeline or by using other search commands.
Next, we have the action icons (described earlier) that affect these particular results.
Under the action icons, we have four results tabs:
- Events list, which will show the raw events. This is the default view when running a simple search, as we have done so far.
- Patterns streamlines the event pattern detection. It displays a list of the most common patterns among the set of events returned by your search. Each of these patterns represents the number of events that share a similar structure.
- Statistics populates when you run a search with transforming commands such as stats, top, chart, and so on. The previous keyword search for error does not display any results in this tab because it does not have any transforming commands.
- Visualization transforms searches and also populates the Visualization tab. The results area of the Visualization tab includes a chart and the statistics table used to generate the chart. Not all searches are eligible for visualization.
Under the tabs described just now, is the timeline.
Options
Beneath the timeline, (starting at the left) is a row of option links that include:
- Show Fields: shows the Selected Fields screen
- List: allows you to select an output option (Raw, List, or Table) for displaying the search results
- Format: provides the ability to set Result display options, such as Show row numbers, Wrap results, the Max lines (to display) and Drilldown as on or off.
- NN Per Page: is where you can indicate the number of results to show per page (10, 20, or 50).
To the right are options that you can use to choose a page of results, and to change the number of events per page.
In prior versions of Splunk, these options were available from the Results display options popup dialog.
The events viewer
Finally, we make it to the actual events. Let's examine a single event.

Starting at the left, we have:
- Event Details: Clicking here (indicated by the right facing arrow) opens the selected event, providing specific information about the event by type, field, and value, and allows you the ability to perform specific actions on a particular event field. In addition, Splunk version 6.2.0 offers a button labeled Event Actions to access workflow actions, a few of which are always available.
- Build Eventtype: Event types are a way to name events that match a certain query.
- Extract Fields: This launches an interface for creating custom field extractions.
- Show Source: This pops up a window with a simulated view of the original source.
- The event number: Raw search results are always returned in the order most recent first.
- Next to appear are any workflow actions that have been configured. Workflow actions let you create new searches or links to other sites, using data from an event.
- Next comes the parsed date from this event, displayed in the time zone selected by the user. This is an important and often confusing distinction. In most installations, everything is in one time zone—the servers, the user, and the events. When one of these three things is not in the same time zone as the others, things can get confusing.
- Next, we see the raw event itself. This is what Splunk saw as an event. With no help, Splunk can do a good job finding the date and breaking lines appropriately, but as we will see later, with a little help, event parsing can be more reliable and more efficient.
- Below the event are the fields that were selected in the field picker. Clicking on the value adds the field value to the search.
Summary
As you have seen, the Splunk GUI provides a rich interface for working with search results. We have really only scratched the surface and will cover more elements.
Resources for Article:
Further resources on this subject:
 United States
 Great Britain
 India
India
 Germany
 France
 Canada
 Russia
 Spain
Spain
 Brazil
 Australia
 South Africa
 Thailand
 Ukraine
 Switzerland
 Slovakia
 Luxembourg
 Hungary
 Romania
 Denmark
 Ireland
 Estonia
 Belgium
 Italy
Italy
 Finland
 Cyprus
 Lithuania
 Latvia
 Malta
Malta
 Netherlands
 Portugal
 Slovenia
 Sweden
 Argentina
 Colombia
 Ecuador
 Indonesia
 Mexico
 New Zealand
 Norway
 South Korea
 Taiwan
 Turkey
 Czechia
 Austria
 Greece
 Isle of Man
 Bulgaria
 Japan
Japan
 Philippines
 Poland
 Singapore
 Egypt
Egypt
 Chile
Chile
 Malaysia


