Search icon CANCEL
Subscription
0
Cart icon
Your Cart (0 item)
Close icon
You have no products in your basket yet
Save more on your purchases! discount-offer-chevron-icon
Savings automatically calculated. No voucher code required.
Arrow left icon
All Products
Best Sellers
New Releases
Books
Videos
Audiobooks
Learning Hub
Newsletter Hub
Free Learning
Arrow right icon
timer SALE ENDS IN
0 Days
:
00 Hours
:
00 Minutes
:
00 Seconds
Arrow up icon
GO TO TOP
VMware vSphere Troubleshooting

You're reading from   VMware vSphere Troubleshooting Gain expertise in troubleshooting most common issues to implement vSphere environments with ease

Arrow left icon
Product type Paperback
Published in Nov 2015
Publisher
ISBN-13 9781783551767
Length 270 pages
Edition 1st Edition
Tools
Arrow right icon
Author (1):
Arrow left icon
 Zeeshan Munir Zeeshan Munir
Author Profile Icon Zeeshan Munir
Zeeshan Munir
Arrow right icon
View More author details
Toc

Table of Contents (16) Chapters Close

VMware vSphere Troubleshooting
Credits
About the Author
About the Reviewers
www.PacktPub.com
Preface
1. The Methodology of Problem Solving FREE CHAPTER 2. Monitoring and Troubleshooting Host and VM Performance 3. Troubleshooting Clusters 4. Monitoring and Troubleshooting Networking 5. Monitoring and Troubleshooting Storage 6. Advanced Troubleshooting of vCenter Server and vSphere Hosts Learning PowerGUI Basics Installing VMware vRealize Operations Manager Power CLI - A Basic Reference Index

Configuring logging level for performance


The VMware vCenter Server provides you with the option of configuring statistics intervals for how often data should be captured, how long the data should remain in the database, and what kind data it should be collecting.

  1. Log in to your vSphere client and click on vCenter Server Settings. This will open up a new window.

  2. Click on Statistics in the left column.

  3. From here, you can choose the Interval Duration of the metrics, how long the vCenter Server should store the data of these metrics, and at what level these statistics should be collected.

  4. Click the first interval 5 Minutes and then click Edit. A new window will pop up.

  5. You can configure Statistics Level from 1 to 4 in this window. The higher the statistics level, the more data it will collect with more counters. Level 4 will collect data for all the counters supported by the vCenter Server. For now, you can choose Level 2 and click OK.

  6. Click OK again to exit the Statistics window.
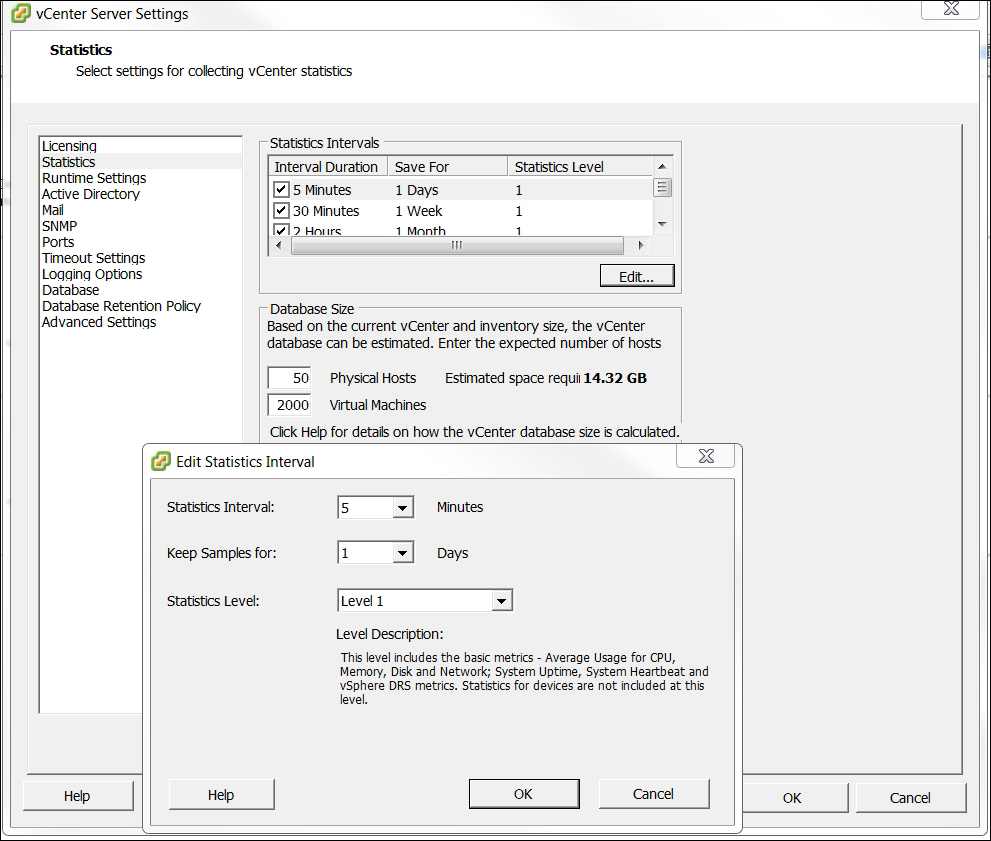
    Figure 2.18

lock icon The rest of the chapter is locked
Register for a free Packt account to unlock a world of extra content!
A free Packt account unlocks extra newsletters, articles, discounted offers, and much more. Start advancing your knowledge today.
Unlock this book and the full library FREE for 7 days
Get unlimited access to 7000+ expert-authored eBooks and videos courses covering every tech area you can think of
Renews at £13.99/month. Cancel anytime
Visually different images