Search icon CANCEL
Subscription
0
Cart icon
Your Cart (0 item)
Close icon
You have no products in your basket yet
Save more on your purchases! discount-offer-chevron-icon
Savings automatically calculated. No voucher code required.
Arrow left icon
All Products
Best Sellers
New Releases
Books
Videos
Audiobooks
Learning Hub
Newsletter Hub
Free Learning
Arrow right icon
timer SALE ENDS IN
0 Days
:
00 Hours
:
00 Minutes
:
00 Seconds
Arrow up icon
GO TO TOP
Tableau 10 Business Intelligence Cookbook

You're reading from   Tableau 10 Business Intelligence Cookbook Create powerful, effective visualizations with Tableau 10

Arrow left icon
Product type Paperback
Published in Nov 2016
Publisher Packt
ISBN-13 9781786465634
Length 476 pages
Edition 1st Edition
Tools
Arrow right icon
Authors (2):
Arrow left icon
Donabel Santos Donabel Santos
Author Profile Icon Donabel Santos
Donabel Santos
Paul Banoub Paul Banoub
Author Profile Icon Paul Banoub
Paul Banoub
Arrow right icon
View More author details
Toc

Table of Contents (17) Chapters Close

Tableau 10 Business Intelligence Cookbook
Credits
About the Author
Acknowledgements
About the Reviewer
www.PacktPub.com
Preface
1. Basic Charts 2. Advanced Charts FREE CHAPTER 3. Interactivity 4. Dashboards and Story Points 5. Maps and Geospatial Visualization 6. Analytics 7. Data Preparation Calculated Fields Primer Resources Index

Mapping custom polygons


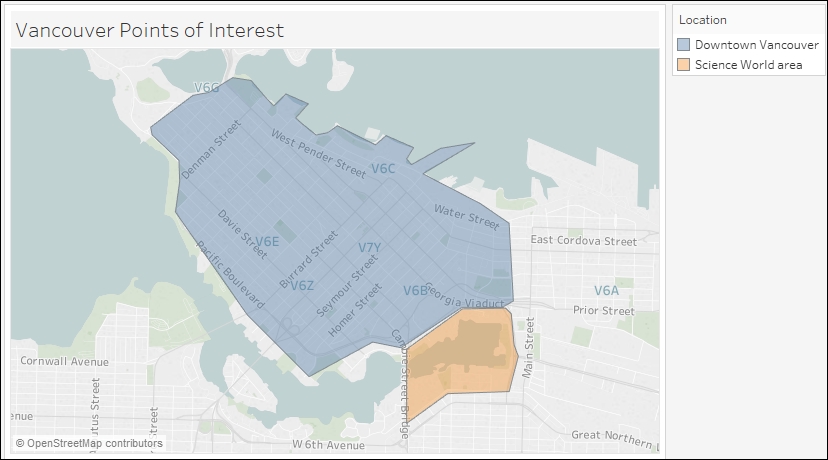
Tableau supports not only using geographic map tiles, but also drawing and display custom polygons (or closed shapes). This can be helpful when visualizing or emphasizing certain areas in a map or background image.

In this recipe, we will draw custom polygons around two points of interest in Vancouver, Canada:

Getting ready

To follow this recipe, open B05527_05 – STARTER.twbx. Use the worksheet called Custom Polygon, and connect to the Vancouver Points of Interest data source:

How to do it...

Here are the steps to create the custom polygon areas:

  1. Change the mark type in the Marks card dropdown to Polygon.

  2. Double-click on the Latitude and Longitude appearing under Measures. Make sure you double-click the Latitude and Longitude fields from the data source, not the ones that have the (generated) suffix.

  3. From Dimensions, drag Shape Id to Detail.

  4. From Measures, drag Point to Path in the Marks card.

  5. Go to the Analysis menu, and uncheck Aggregate.

  6. From Dimensions, drag Location...

lock icon The rest of the chapter is locked
Register for a free Packt account to unlock a world of extra content!
A free Packt account unlocks extra newsletters, articles, discounted offers, and much more. Start advancing your knowledge today.
Unlock this book and the full library FREE for 7 days
Get unlimited access to 7000+ expert-authored eBooks and videos courses covering every tech area you can think of
Renews at £13.99/month. Cancel anytime
Visually different images