


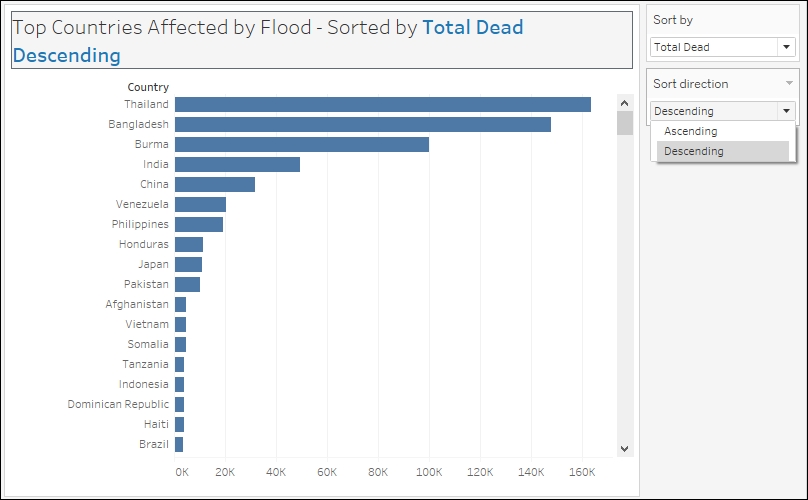
Dynamically displaying and sorting measures
In this recipe, we will walk through the strategy to display and sort measures based on user selection.
Getting ready
To follow this recipe, open B05527_03 – STARTER.twbx. Use the worksheet called Dynamic Measure Display and Sort, and connect to the MasterTable (FlooddataMastListrev) data source.
How to do it…
The following are the steps to create a chart that enables displaying and sorting measures through a parameter:
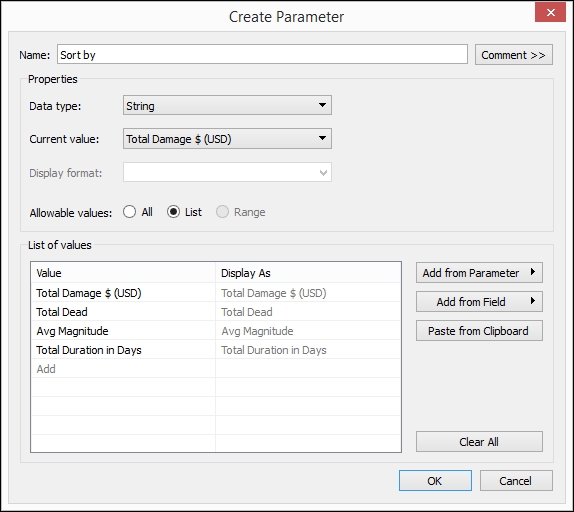
Right-click the arrow beside the Dimensions section in the side bar, and select Create Parameter.
Create a string parameter called Sort by with the following settings:
Show the parameter control for Sort by. You can do this by right-clicking on the parameter, and selecting Show Parameter Control.
Create another parameter called
Sort directionwith the following settings: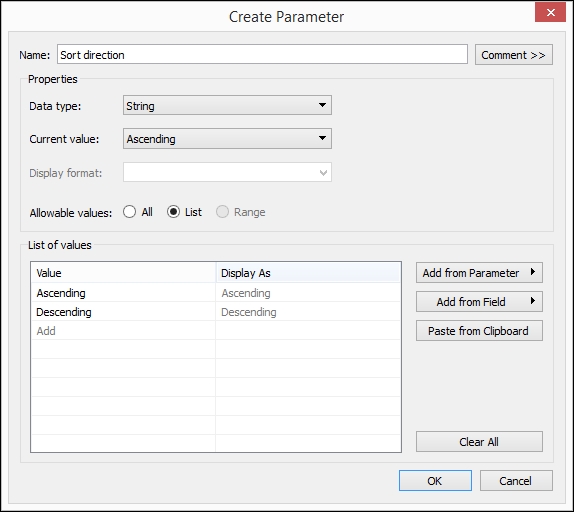
Show the Sort direction parameter control.
Create a calculated field called
Chosen Sort bywith the following formula: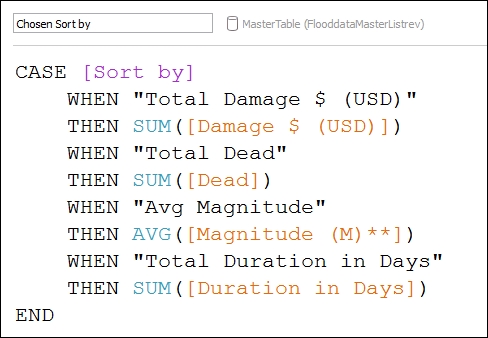
Create another calculated field called
Chosen Sort by...


