Search icon CANCEL
Subscription
0
Cart icon
Your Cart (0 item)
Close icon
You have no products in your basket yet
Save more on your purchases! discount-offer-chevron-icon
Savings automatically calculated. No voucher code required.
Arrow left icon
All Products
Best Sellers
New Releases
Books
Videos
Audiobooks
Learning Hub
Newsletter Hub
Free Learning
Arrow right icon
timer SALE ENDS IN
0 Days
:
00 Hours
:
00 Minutes
:
00 Seconds
Arrow up icon
GO TO TOP
Tableau 10 Business Intelligence Cookbook

You're reading from   Tableau 10 Business Intelligence Cookbook Create powerful, effective visualizations with Tableau 10

Arrow left icon
Product type Paperback
Published in Nov 2016
Publisher Packt
ISBN-13 9781786465634
Length 476 pages
Edition 1st Edition
Tools
Arrow right icon
Authors (2):
Arrow left icon
Donabel Santos Donabel Santos
Author Profile Icon Donabel Santos
Donabel Santos
Paul Banoub Paul Banoub
Author Profile Icon Paul Banoub
Paul Banoub
Arrow right icon
View More author details
Toc

Table of Contents (17) Chapters Close

Tableau 10 Business Intelligence Cookbook
Credits
About the Author
Acknowledgements
About the Reviewer
www.PacktPub.com
Preface
1. Basic Charts 2. Advanced Charts FREE CHAPTER 3. Interactivity 4. Dashboards and Story Points 5. Maps and Geospatial Visualization 6. Analytics 7. Data Preparation Calculated Fields Primer Resources Index

Visualizing forecast


Forecasting is the process of trying to predict what might happen in the future based on historical data and trends.

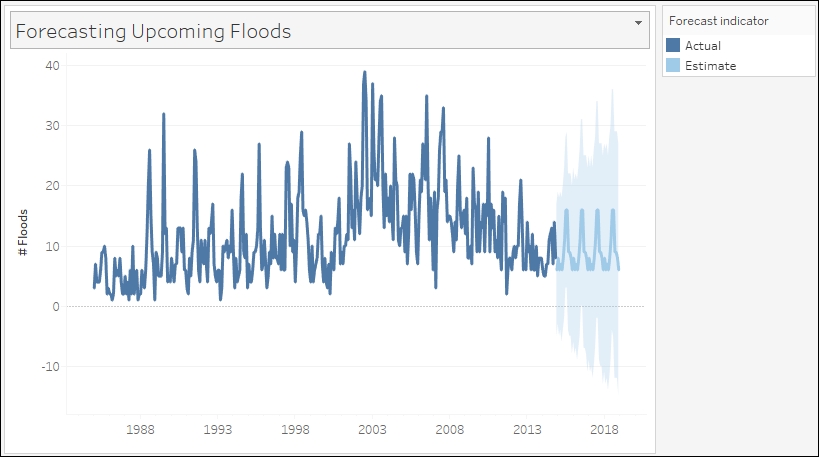
In this recipe, we will use Tableau's forecasting feature to forecast upcoming floods using flood data from 1985 to 2014:

Getting ready

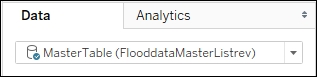
To follow this recipe, open B05527_06 – STARTER.twbx. Use the worksheet called Forecasting and connect to the MasterTable (FlooddataMasterListrev) data source:

How to do it...

Here are the steps to create the view in this recipe:

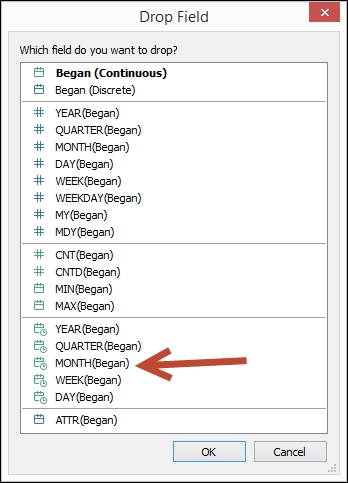
  1. From Dimensions, right-click and drag the Began field to the Columns shelf. Choose continuous MONTH(Began):

  2. From Measures, drag Number of Records to the Rows shelf.

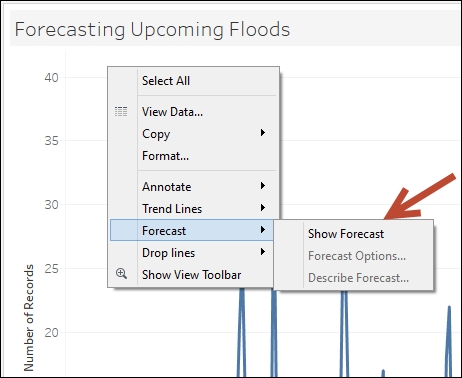
  3. Right-click anywhere in the view to show additional options.

  4. Under Forecast, select Show Forecast:

How it works...

Tableau's forecasting feature uses a technique called exponential smoothing, as described in the online documentation at http://bit.ly/tableau-forecasting. Typically, when forecasting, one of the axes needs to be temporal (or date...

lock icon The rest of the chapter is locked
Register for a free Packt account to unlock a world of extra content!
A free Packt account unlocks extra newsletters, articles, discounted offers, and much more. Start advancing your knowledge today.
Unlock this book and the full library FREE for 7 days
Get unlimited access to 7000+ expert-authored eBooks and videos courses covering every tech area you can think of
Renews at £13.99/month. Cancel anytime
Visually different images