Search icon CANCEL
Subscription
0
Cart icon
Your Cart (0 item)
Close icon
You have no products in your basket yet
Save more on your purchases! discount-offer-chevron-icon
Savings automatically calculated. No voucher code required.
Arrow left icon
All Products
Best Sellers
New Releases
Books
Videos
Audiobooks
Learning Hub
Newsletter Hub
Free Learning
Arrow right icon
timer SALE ENDS IN
0 Days
:
00 Hours
:
00 Minutes
:
00 Seconds
Arrow up icon
GO TO TOP
Tableau 10 Business Intelligence Cookbook

You're reading from   Tableau 10 Business Intelligence Cookbook Create powerful, effective visualizations with Tableau 10

Arrow left icon
Product type Paperback
Published in Nov 2016
Publisher Packt
ISBN-13 9781786465634
Length 476 pages
Edition 1st Edition
Tools
Arrow right icon
Authors (2):
Arrow left icon
Donabel Santos Donabel Santos
Author Profile Icon Donabel Santos
Donabel Santos
Paul Banoub Paul Banoub
Author Profile Icon Paul Banoub
Paul Banoub
Arrow right icon
View More author details
Toc

Table of Contents (17) Chapters Close

Tableau 10 Business Intelligence Cookbook
Credits
About the Author
Acknowledgements
About the Reviewer
www.PacktPub.com
Preface
1. Basic Charts 2. Advanced Charts FREE CHAPTER 3. Interactivity 4. Dashboards and Story Points 5. Maps and Geospatial Visualization 6. Analytics 7. Data Preparation Calculated Fields Primer Resources Index

Creating a KPI text table


Key performance indicators, or KPIs, are metrics that indicate how well an organization is performing against its objectives. KPIs are typically represented as easily understandable color-coded symbols in a dashboard. For example, a red circle could mean that area is not meeting objectives, while a green circle does.

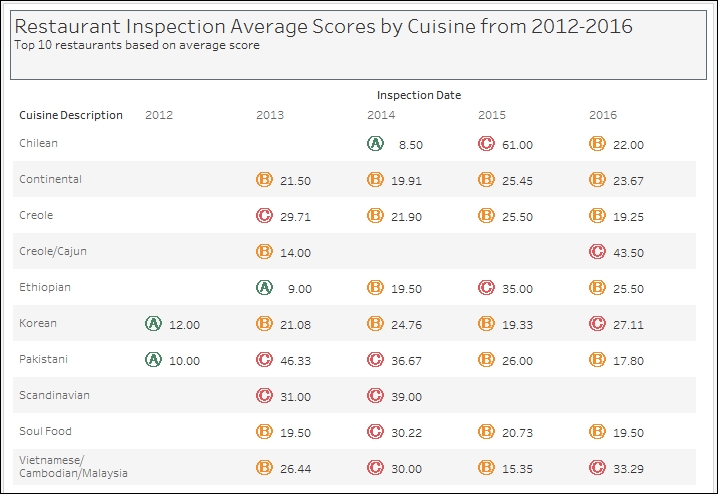
In this recipe, we will show the top 10 New York restaurant cuisines based on their average inspection scores from 2012-2016 in a text table with KPIs.

Getting ready

To follow this recipe, open B05527_02 – STARTER.twbx. Use the worksheet called KPI Text Table, and connect to the DOHMH New York City Restaurant data source.

How to do it...

The following are the steps to create a KPI table:

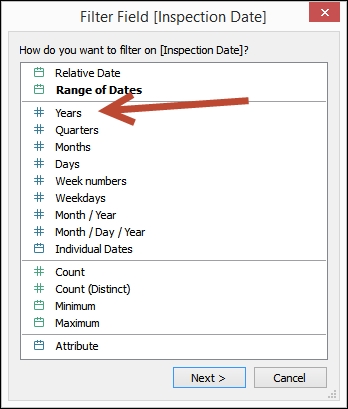
  1. From Dimensions, drag Inspection Date to the Filters shelf.

  2. When prompted on what to filter, choose Years.

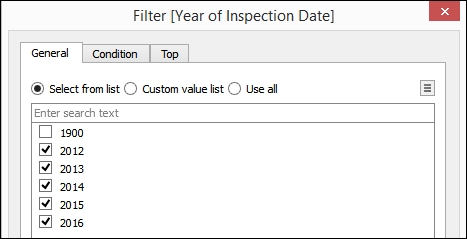
  3. In the next window, under the General tab, select all years except 1900.

  4. From Dimensions, drag Inspection Date to the Columns shelf.

  5. From Dimensions, drag Cuisine Description...

You have been reading a chapter from
Tableau 10 Business Intelligence Cookbook
Published in: Nov 2016
Publisher: Packt
ISBN-13: 9781786465634
Register for a free Packt account to unlock a world of extra content!
A free Packt account unlocks extra newsletters, articles, discounted offers, and much more. Start advancing your knowledge today.
Unlock this book and the full library FREE for 7 days
Get unlimited access to 7000+ expert-authored eBooks and videos courses covering every tech area you can think of
Renews at £13.99/month. Cancel anytime
Visually different images