


Getting information through TCP stream graphs – the Window Scaling Graph window
The Window Scaling Graph of the TCP stream graph enables us to look at the window size published by the receiving side, which is an indication of the receiver's ability to process data. Along with the other graphs, it provides us with a look at the performance of the connection.
Getting ready
Open an existing capture or start a new capture. Click on a specific packet in the capture file. Even though you can use this feature on a running capture, it is not meant for online statistics, so it is recommended that you start a capture, stop it, and then use this tool.
How to do it...
To view TCP stream graph statistics, perform the following steps:
Click on a packet in the stream you want to monitor.
From the Statistics menu navigate to TCP StreamGraph | Window Scaling Graph. The following window will open up:
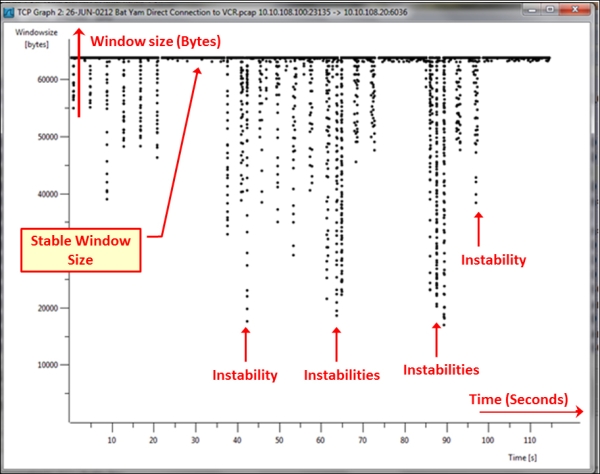
In this graph, we see the instability caused by one of the sides. This can be an indication of a slow server or client...


