Search icon CANCEL
Subscription
0
Cart icon
Your Cart (0 item)
Close icon
You have no products in your basket yet
Save more on your purchases! discount-offer-chevron-icon
Savings automatically calculated. No voucher code required.
Arrow left icon
All Products
Best Sellers
New Releases
Books
Videos
Audiobooks
Learning Hub
Newsletter Hub
Free Learning
Arrow right icon
timer SALE ENDS IN
0 Days
:
00 Hours
:
00 Minutes
:
00 Seconds
Arrow up icon
GO TO TOP
Microsoft Dynamics AX 2012 R3 Reporting Cookbook Update

You're reading from   Microsoft Dynamics AX 2012 R3 Reporting Cookbook Update Over 90 recipes to help you resolve your new SSRS Reporting woes in Dynamics AX 2012 R3

Arrow left icon
Product type Paperback
Published in Mar 2015
Publisher
ISBN-13 9781784395384
Length 352 pages
Edition 1st Edition
Languages
Arrow right icon
Authors (3):
Arrow left icon
 Agarwal Agarwal
Author Profile Icon Agarwal
Agarwal
 Aggarwal Aggarwal
Author Profile Icon Aggarwal
Aggarwal
Kamalakannan Elangovan Kamalakannan Elangovan
Author Profile Icon Kamalakannan Elangovan
Kamalakannan Elangovan
Arrow right icon
View More author details
Toc

Table of Contents (17) Chapters Close

Microsoft Dynamics AX 2012 R3 Reporting Cookbook
Credits
About the Authors
About the Reviewers
www.PacktPub.com
Preface
1. Understanding and Creating Simple SSRS Reports FREE CHAPTER 2. Enhancing Your Report – Visualization and Interaction 3. Report Programming Model 4. Report Programming Model – RDP 5. Integrating External Datasources 6. Beyond Tabular Reports 7. Upgrading and Analyzing Reports 8. Troubleshooting and Other Advanced Recipes 9. Developing Reports with Complex Databases 10. Unit Test Class and Best Practices Used for Reports Index

List and rectangle controls in reports


List and rectangle are types of container controls in SSRS. Rectangle control is used for the flow control, while the List data region is a kind of array control. The List region can help in creating very interesting representations of the report. In this recipe, we will discuss the idea of the list and rectangle controls in the process of building a summary sheet for each item group.

How to do it…

  1. Create a new report with the RDP PktItemSalesHistoryDP, and add a new precision design.

  2. In the editor window, insert a list region. Right-click on the control and select the Tablix properties. In the properties window, set the dataset to the RDP dataset ItemSalesHistory.

  3. The Row Groups window, which is at the bottom, must indicate a details row. Click on the arrow at the corner and open Group Properties:

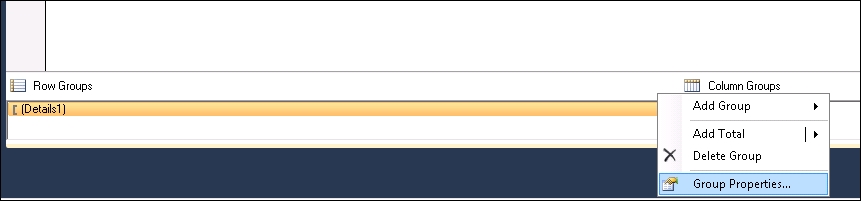
  4. In Group Properties, add a new grouping by ItemGroupId:

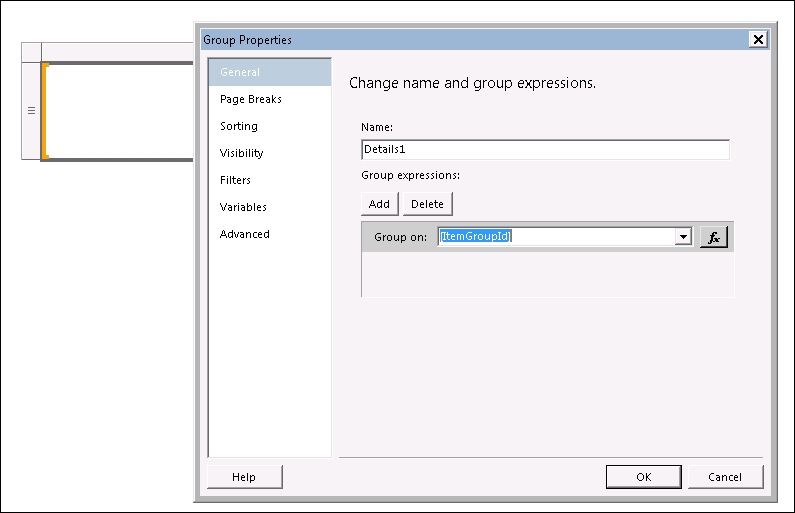
  5. Stretch the list data region to fit the entire report. From the toolbox, drag the text box control...

lock icon The rest of the chapter is locked
Register for a free Packt account to unlock a world of extra content!
A free Packt account unlocks extra newsletters, articles, discounted offers, and much more. Start advancing your knowledge today.
Unlock this book and the full library FREE for 7 days
Get unlimited access to 7000+ expert-authored eBooks and videos courses covering every tech area you can think of
Renews at £13.99/month. Cancel anytime
Visually different images