


Customizing your charts
As mentioned before, one of the big advantages of ggplot2 is that you can change nearly all elements according your individual needs. In the following section, we will show you some ways to customize your visualizations.
Subsetting your data
A very handy feature of ggplot2 is the way you can subset data. Just add a subset function call to your graph to just visualize certain values. The subset you want to visualize can be set for all geoms:
ggplot(iris) %+% subset(iris,Species == "setosa") + geom_point(aes(Sepal.Length, Sepal.Width))
Otherwise, you can set it for one geom in your graph:
ggplot(iris,aes(x = Sepal.Length,y = Sepal.Width,color = Species)) + geom_point(data = subset(iris, Species %in% c("setosa","virginica")))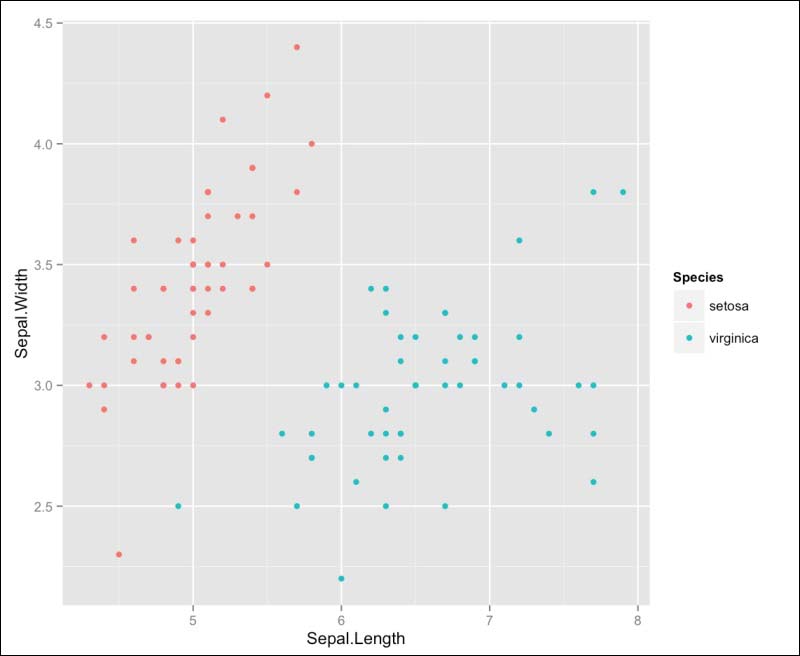
Setting titles
In ggplot2 it is very easy to add titles to graphs. Therefore, it provides the ggtitle function. You can just add it to your graph with the plus (+) operator:
d <- ggplot(iris, aes(Species, Sepal.Length, fill = Species)) + geom_bar(stat...


