Search icon CANCEL
Subscription
0
Cart icon
Your Cart (0 item)
Close icon
You have no products in your basket yet
Save more on your purchases! discount-offer-chevron-icon
Savings automatically calculated. No voucher code required.
Arrow left icon
All Products
Best Sellers
New Releases
Books
Videos
Audiobooks
Learning Hub
Newsletter Hub
Free Learning
Arrow right icon
timer SALE ENDS IN
0 Days
:
00 Hours
:
00 Minutes
:
00 Seconds
Arrow up icon
GO TO TOP
Mastering Kibana 6.x

You're reading from   Mastering Kibana 6.x Visualize your Elastic Stack data with histograms, maps, charts, and graphs

Arrow left icon
Product type Paperback
Published in Jul 2018
Publisher Packt
ISBN-13 9781788831031
Length 376 pages
Edition 1st Edition
Languages
Tools
Arrow right icon
Toc

Table of Contents (21) Chapters Close

Title Page
Copyright and Credits
Packt Upsell
Contributors
Preface
1. Revising the ELK Stack FREE CHAPTER 2. Setting Up and Customizing the Kibana Dashboard 3. Exploring Your Data 4. Visualizing the Data 5. Dashboarding to Showcase Key Performance Indicators 6. Handling Time Series Data with Timelion 7. Interact with Your Data Using Dev Tools 8. Tweaking Your Configuration with Kibana Management 9. Understanding X-Pack Features 10. Machine Learning with Kibana 11. Create Super Cool Dashboard from a Web Application 12. Different Use Cases of Kibana 13. Creating Monitoring Dashboards Using Beats 14. Best Practices 1. Other Books You May Enjoy Index

Markdown


Markdown is the simplest visualization in Kibana, and comes under the other category. Markdown provides us with the option to create visualizations by providing any text message. We can create the text message and put it into the dashboard.

Creating a markdown visualization

To create the markdown visualization, we need to click on the Markdown box on the Select visualization type page. After that, we need to do the following:

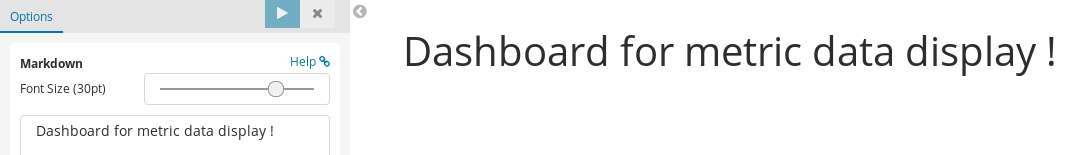
  1. Add the text content in the given text-area under the font size controller.
  2. Increase or decrease the font using the Font Size controller.
  3. Click on the Apply changes button to show the markdown:

This will create the text markdown chart, which we can add to a dashboard as per our requirements. We can save this visualization in the same way as we did with the earlier charts.

lock icon The rest of the chapter is locked
Register for a free Packt account to unlock a world of extra content!
A free Packt account unlocks extra newsletters, articles, discounted offers, and much more. Start advancing your knowledge today.
Unlock this book and the full library FREE for 7 days
Get unlimited access to 7000+ expert-authored eBooks and videos courses covering every tech area you can think of
Renews at £13.99/month. Cancel anytime
Visually different images