Search icon CANCEL
Subscription
0
Cart icon
Your Cart (0 item)
Close icon
You have no products in your basket yet
Save more on your purchases! discount-offer-chevron-icon
Savings automatically calculated. No voucher code required.
Arrow left icon
All Products
Best Sellers
New Releases
Books
Videos
Audiobooks
Learning Hub
Newsletter Hub
Free Learning
Arrow right icon
timer SALE ENDS IN
0 Days
:
00 Hours
:
00 Minutes
:
00 Seconds
Arrow up icon
GO TO TOP
Mastering Kibana 6.x

You're reading from   Mastering Kibana 6.x Visualize your Elastic Stack data with histograms, maps, charts, and graphs

Arrow left icon
Product type Paperback
Published in Jul 2018
Publisher Packt
ISBN-13 9781788831031
Length 376 pages
Edition 1st Edition
Languages
Tools
Arrow right icon
Toc

Table of Contents (21) Chapters Close

Title Page
Copyright and Credits
Packt Upsell
Contributors
Preface
1. Revising the ELK Stack FREE CHAPTER 2. Setting Up and Customizing the Kibana Dashboard 3. Exploring Your Data 4. Visualizing the Data 5. Dashboarding to Showcase Key Performance Indicators 6. Handling Time Series Data with Timelion 7. Interact with Your Data Using Dev Tools 8. Tweaking Your Configuration with Kibana Management 9. Understanding X-Pack Features 10. Machine Learning with Kibana 11. Create Super Cool Dashboard from a Web Application 12. Different Use Cases of Kibana 13. Creating Monitoring Dashboards Using Beats 14. Best Practices 1. Other Books You May Enjoy Index

Configuring the Beats


First, we will cover the configuration of different Beats in order to get the metric data into Elasticsearch directly or using Logstash, based on our requirements. The following flowchart shows us the way through which Beats ship the data to Logstash or Elasticsearch and then we can plot into Kibana using that data:

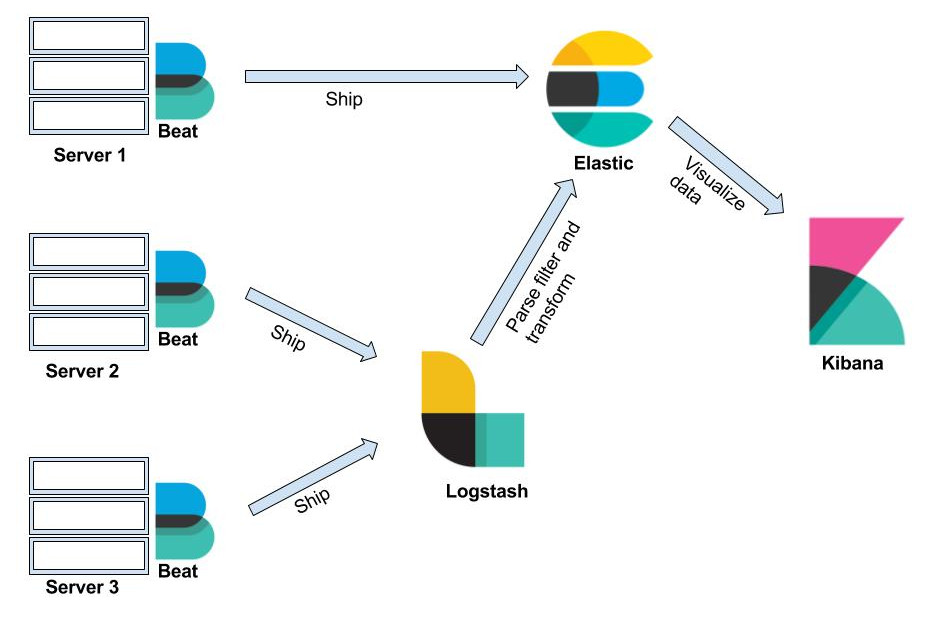
We will configure Filebeat, Metricbeat, and Packetbeat so that these Beats can send the data to the central Elasticseach cluster or Logstash. Once this process is started, we can use the Elasticseach data to create different visualizations and can then integrate those visualizations to create the dashboard. So, let's start the Beats configuration.

Filebeat

Filebeat is a lightweight data shipper that can be used to forward the logs and files data. Filebeat reads and forwards the log lines and in case of any downtime, it remembers the locations and resumes from that location once everything is back online:

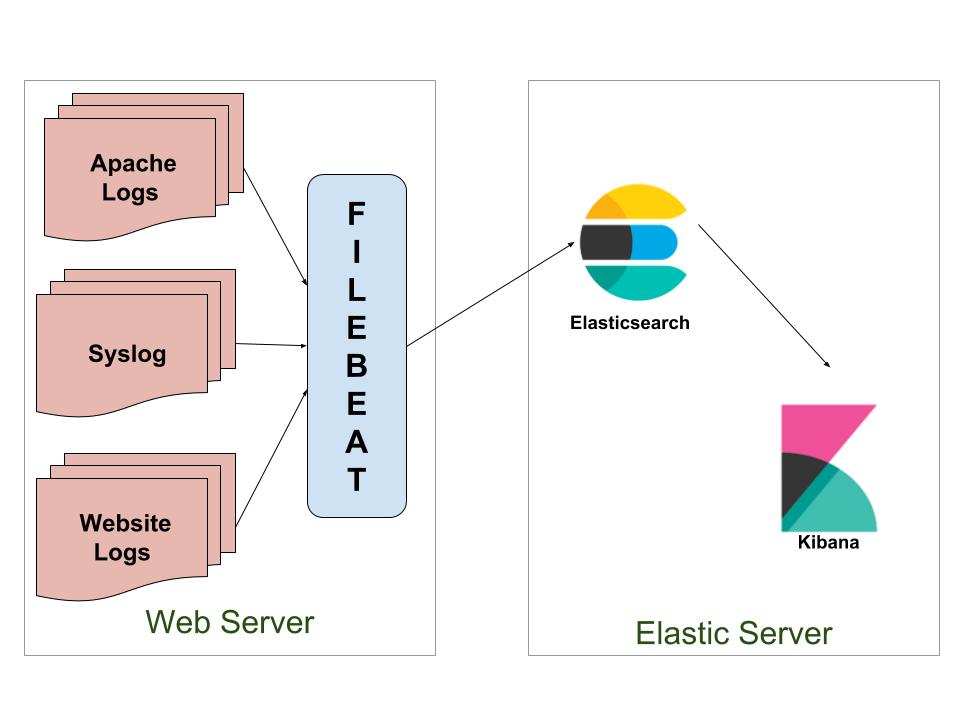
Filebeat has internal modules for Apache, NGINX, MySQL...

lock icon The rest of the chapter is locked
Register for a free Packt account to unlock a world of extra content!
A free Packt account unlocks extra newsletters, articles, discounted offers, and much more. Start advancing your knowledge today.
Unlock this book and the full library FREE for 7 days
Get unlimited access to 7000+ expert-authored eBooks and videos courses covering every tech area you can think of
Renews at £13.99/month. Cancel anytime
Visually different images