
Using add-on charts to visualize data
Apart from the standard charts and gadgets that come with JIRA out of the box, there are certain free add-ons that can be installed to have more such useful charts. Let's take a look at these free plugins and the additional features that they offer.
Barcharts for JIRA
Just install this add-on and you will get the option to add a Barchart gadget in your instance. The bar chart that comes with this add-on offers a few additional features which are not available in standard charts.
We will generate a report similar to one we generated earlier in this chapter. We want to generate a 2D report on Issue Type and Status:
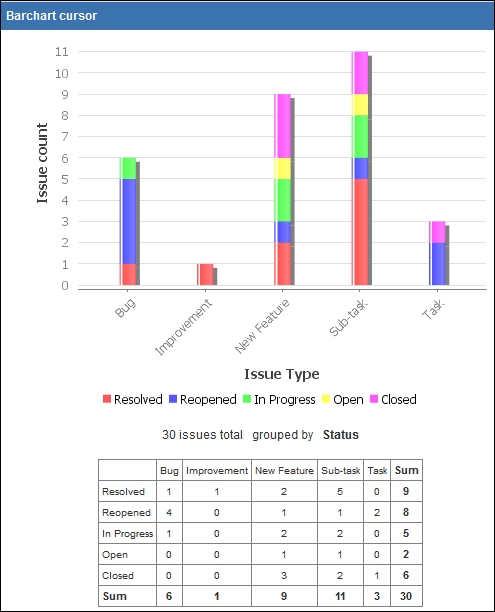
As you can see, this is a stacked bar chart. Also, there is a detailed table just following the chart that displays the actual numbers.
Building advanced reports using eazyBI
The default reports that come built-in with JIRA are quite good and useful. These gadgets can be configured to display a variety of statistics based on different fields associated...