Search icon CANCEL
Subscription
0
Cart icon
Your Cart (0 item)
Close icon
You have no products in your basket yet
Save more on your purchases! discount-offer-chevron-icon
Savings automatically calculated. No voucher code required.
Arrow left icon
All Products
Best Sellers
New Releases
Books
Videos
Audiobooks
Learning Hub
Newsletter Hub
Free Learning
Arrow right icon
timer SALE ENDS IN
0 Days
:
00 Hours
:
00 Minutes
:
00 Seconds
Arrow up icon
GO TO TOP
Machine Learning with R Cookbook, Second Edition

You're reading from   Machine Learning with R Cookbook, Second Edition Analyze data and build predictive models

Arrow left icon
Product type Paperback
Published in Oct 2017
Publisher Packt
ISBN-13 9781787284395
Length 572 pages
Edition 2nd Edition
Languages
Tools
Arrow right icon
Author (1):
Arrow left icon
Yu-Wei, Chiu (David Chiu) Yu-Wei, Chiu (David Chiu)
Author Profile Icon Yu-Wei, Chiu (David Chiu)
Yu-Wei, Chiu (David Chiu)
Arrow right icon
View More author details
Toc

Table of Contents (21) Chapters Close

Title Page
Credits
About the Authors
About the Reviewers
www.PacktPub.com
Customer Feedback
Preface
1. Practical Machine Learning with R FREE CHAPTER 2. Data Exploration with Air Quality Datasets 3. Analyzing Time Series Data 4. R and Statistics 5. Understanding Regression Analysis 6. Survival Analysis 7. Classification 1 - Tree, Lazy, and Probabilistic 8. Classification 2 - Neural Network and SVM 9. Model Evaluation 10. Ensemble Learning 11. Clustering 12. Association Analysis and Sequence Mining 13. Dimension Reduction 14. Big Data Analysis (R and Hadoop)

Understanding the Wilcoxon Rank Sum and Signed Rank test


The Wilcoxon Rank Sum and Signed Rank test (or Mann-Whitney-Wilcoxon) is a nonparametric test of the null hypothesis, which shows that the population distribution of two different groups are identical without assuming that the two groups are normally distributed. This recipe will show how to conduct the Wilcoxon Rank Sum and Signed Rank test in R.

Getting ready

Ensure that mtcars has already been loaded into a DataFrame within an R session. As the wilcox.test function is originated from the stats package, make sure the library, stats, is loaded.

How to do it...

Perform the following steps:

  1. We first plot the data of mtcars with the boxplot function:
        > boxplot
        (mtcars$mpg~mtcars$am,ylab='mpg',names=c('automatic','manual'))

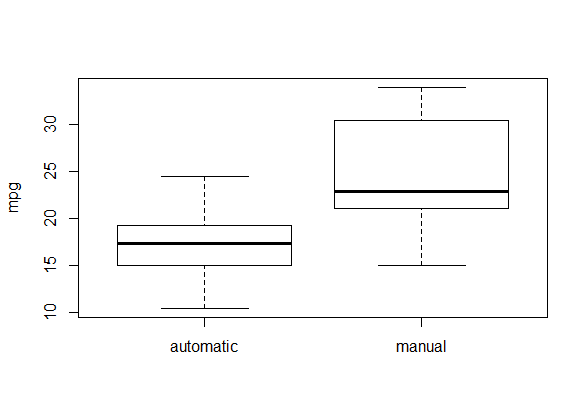
The boxplot of mpg of automatic cars and manual transmission cars

  1. Next, we still perform a Wilcoxon Rank Sum test to validate whether the distribution of automatic transmission cars is identical to that...
lock icon The rest of the chapter is locked
Register for a free Packt account to unlock a world of extra content!
A free Packt account unlocks extra newsletters, articles, discounted offers, and much more. Start advancing your knowledge today.
Unlock this book and the full library FREE for 7 days
Get unlimited access to 7000+ expert-authored eBooks and videos courses covering every tech area you can think of
Renews at £13.99/month. Cancel anytime
Visually different images