
Visualizing planning model data
The model is ready for analysis. As with the analytics model, we once again need to create a temporary story to view the data of this model. Execute the following set of steps for this purpose:
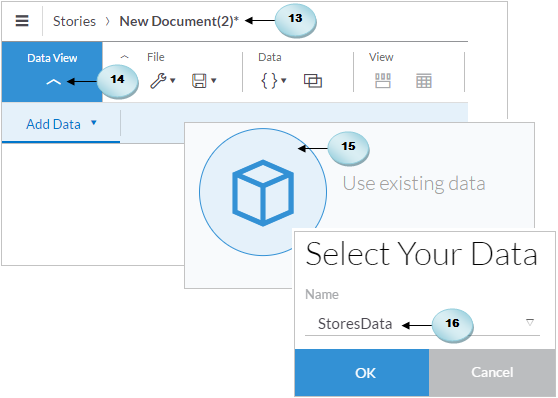
- From the main menu, go to
Create|Story. - On the first wizard page that asks how you want to start the story, select the
Add a Canvas pageoption. The story page will appear with a default name for the new story. - Click on the arrow in the
Data Viewsection on the toolbar. You will be prompted to add data. - On this screen, select
Use existing data. - In the
Select Your Datadialog, selectStoresData. This is the planning model data you uploaded in the previous section. Click onOKto dismiss the dialog:
The data view panels that you worked with in the previous chapter will be presented again. Click on Quantity sold (A) in the Measures pane to see its actual figures. By default, the Version is set to Actual (B). Click on the Show Dimensions icon (C), and select Show All (D) from...