
Customizing TDBGrid
The adage a picture is worth a thousand words refers to the notion that a complex idea can be conveyed with just a single still image. Sometimes, even a simple concept is easier to understand and nicer to see if it is represented by images. In this recipe, we'll see how to customize TDBGrid to visualize a graphical representation of data.
Getting ready
Many VCL controls are able to delegate their drawing, or part of it, to user code. It means that we can use simple event handlers to draw standard components in different ways. It is not always simple, but TDBGrid is customizable in a really easy way. Let's say that we have a class of musicians that have to pass a set of exams. We want to show the percent of exams already passed with a progress bar and if the percent age is higher than 50, there should also be a check mark in another column. Moreover, after listening to the pieces played at the exams, each musician received votes from an external examination committee. The last column needs to show the mean of votes from this committee as a rating from zero to five.
How to do it...
We'll use a special in-memory table from the FireDAC library. FireDAC is a new data access library from Embarcadero included in RAD Studio since version XE5. If some of the code seems unclear at the moment, consider the in-memory table as a normal TDataSet descendant that holds its data only in memory. However, at the end of the section, there are some links to the FireDAC documentation, and I strongly suggest that you read it if you still don't understand FireDAC:
- Create a brand new VCL application and drop a
TFDMemTable, aTDBGrid, aTDataSource, and aTDBNavigatoronto the form. Connect all the components in the usual way (TDBGridconnected toTDataSource, followed byTFDMemTable). Set theTDBGridfont size to18. This will create more space in the cell for our graphical representation. - Using the
TFDMemTablefields editor, add the following fields and then activate the dataset by setting itsActiveproperty toTrue:
Field name | Field data type | Field type |
| String (size 50) | Data |
| Integer | Data |
| Integer | Data |
| Float | Data |
| Float | Calculated |
| Boolean | Calculated |
- Now, add all the columns to
TDBGridby right-clicking and selectingColumnsEditor.... Then, again right-click and selectAdd all fieldsin the resultant window. Then, rearrange the columns as shown here and give it a nice title caption:
FullNameTotalExamsPassedExamsPercPassedExamsMoreThan50PercentRating
- In a real application, we would load real data from some sort of database. However, for now, we'll use some custom data generated in code. We have to load this data into the dataset with the code that follows:
procedure TMainForm.FormCreate(Sender: TObject);
begin
  FDMemTable1.AppendRecord(['Ludwig van Beethoven', 30, 10, 4]);
  FDMemTable1.AppendRecord(['Johann Sebastian Bach', 24, 10, 2.5]);
  FDMemTable1.AppendRecord(['Wolfgang Amadeus Mozart', 30, 30, 5]);
  FDMemTable1.AppendRecord(['Giacomo Puccini', 25, 10, 2.2]);
  FDMemTable1.AppendRecord(['Antonio Vivaldi', 20, 20, 4.7]);
  FDMemTable1.AppendRecord(['Giuseppe Verdi', 30, 5, 5]);
  FDMemTable1.AppendRecord(['John Doe', 24, 5, 1.2]);
end;
- Do you remember we have two calculated fields that need to be filled in some way? Calculated fields need a form of processing behind them to work.
TFDMemTable, just like any otherTDataSetdescendant, has an event calledOnCalcFieldsthat allows the developer to do this. Create theOnCalcFieldsevent handler forTFDMemTableand fill it with the following code:
procedure TMainForm.FDMemTable1CalcFields(DataSet: TDataSet);
var
  LPassedExams: Integer;
  LTotExams: Integer;
begin
  LPassedExams := FDMemTable1.FieldByName('PassedExams').AsInteger;
  LTotExams := FDMemTable1.FieldByName('TotalExams').AsInteger;
  if LTotExams = 0 then
    FDMemTable1.FieldByName('PercPassedExams').AsFloat := 0
  else
    FDMemTable1.FieldByName('PercPassedExams').AsFloat := LPassedExams /
      LTotExams * 100;

  FDMemTable1.FieldByName('MoreThan50Percent').AsBoolean :=
    FDMemTable1.FieldByName('PercPassedExams').AsFloat > 50;

end;
- Run the application by hitting F9 (or by going to
Run|Run) and you will get the following screenshot:
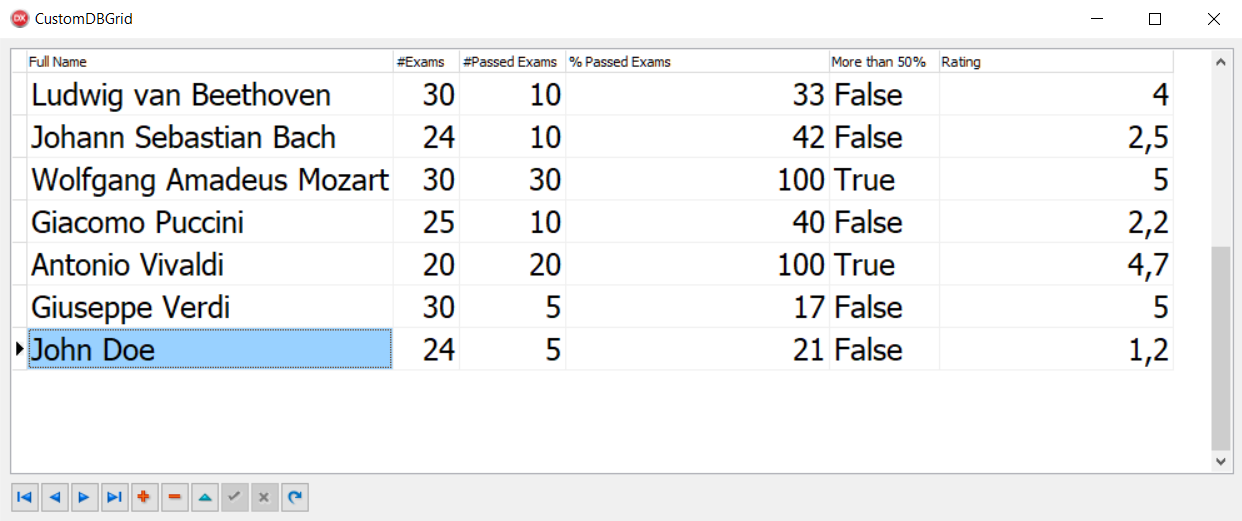
Figure 1.5: A normal form with some data
- This is useful, but a bit boring. Let's start our customization. Close the application and return to the Delphi IDE.
- Go to
PropertiesofTDBGridand setDefault DrawingtoFalse. - Now, we have to organize the resources used to draw the grid cells. Calculated fields will be drawn directly using code, but the
Ratingfield will be drawn using a five-star rating image from0to5. It starts with a0.5incremental step (0,0.5,1,1.5, and so on). So, dropTImageListon the form, and set theHeightas32and theWidthas160.
- Select the
TImageListcomponent and open the image list's editor by right-clicking and then selectingImageList Editor.... You can find the required PNG images in the recipe's project folder (ICONS\RATING_IMAGES). Load the images in the correct order, as shown here:
- Index 0 as
image 0_0_rating.png - Index 1 as
image 0_5_rating.png - Index 2 as
image 1_0_rating.png - Index 3 as
image 1_5_rating.png - Index 4 as
image 2_0_rating.png
- Go to the
TDBGridevent and create the event handler forOnDrawColumnCell. All the customization code goes in this event. Include theVcl.GraphUtilunit, and write the following code in theDBGrid1DrawColumnCellevent:
procedure TMainForm.DBGrid1DrawColumnCell(Sender: TObject; const Rect: TRect;
  DataCol: Integer; Column: TColumn; State: TGridDrawState);
var
  LRect: TRect;
  LGrid: TDBGrid;
  LText: string;
  LPerc: Extended;
  LTextWidth: TSize;
  LRating: Extended;
  LNeedOwnerDraw: Boolean;
  LImageIndex: Int64;
begin
  LGrid := TDBGrid(Sender);
if [gdSelected, gdFocused] * State <> [] then
    LGrid.Canvas.Brush.Color := clHighlight;

  LNeedOwnerDraw := (Column.Field.FieldKind = fkCalculated) or
    Column.FieldName.Equals('Rating');

  // if doesn't need owner-draw, default draw is called
ifnot LNeedOwnerDraw then
begin
    LGrid.DefaultDrawColumnCell(Rect, DataCol, Column, State);
    exit;
end;

  LRect := Rect;

if Column.FieldName.Equals('PercPassedExams') then
begin
    LText := FormatFloat('##0', Column.Field.AsFloat) + ' %';
    LGrid.Canvas.Brush.Style := bsSolid;
    LGrid.Canvas.FillRect(LRect);
    LPerc := Column.Field.AsFloat / 100 * LRect.Width;
    LGrid.Canvas.Font.Size := LGrid.Font.Size - 1;
    LGrid.Canvas.Font.Color := clWhite;
    LGrid.Canvas.Brush.Color := clYellow;
    LGrid.Canvas.RoundRect(LRect.Left, LRect.Top, Trunc(LRect.Left + LPerc),
      LRect.Bottom, 2, 2);
    LRect.Inflate(-1, -1);
    LGrid.Canvas.Pen.Style := psClear;
    LGrid.Canvas.Font.Color := clBlack;
    LGrid.Canvas.Brush.Style := bsClear;

    LTextWidth := LGrid.Canvas.TextExtent(LText);
    LGrid.Canvas.TextOut(LRect.Left + ((LRect.Width div 2) -
      (LTextWidth.cx div 2)), LRect.Top + ((LRect.Height div 2) -
      (LTextWidth.cy div 2)), LText);
end
else if Column.FieldName.Equals('MoreThan50Percent') then
begin
    LGrid.Canvas.Brush.Style := bsSolid;
    LGrid.Canvas.Pen.Style := psClear;
    LGrid.Canvas.FillRect(LRect);
if Column.Field.AsBoolean then
begin
      LRect.Inflate(-4, -4);
      LGrid.Canvas.Pen.Color := clRed;
      LGrid.Canvas.Pen.Style := psSolid;
      DrawCheck(LGrid.Canvas, TPoint.Create(LRect.Left,
        LRect.Top + LRect.Height div 2), LRect.Height div 3);
end;
  end
  else if Column.FieldName.Equals('Rating') then
begin
    LRating := Column.Field.AsFloat;
if Frac(LRating) < 0.5 then
      LRating := Trunc(LRating)
else
      LRating := Trunc(LRating) + 0.5;
    LText := LRating.ToString;
    LGrid.Canvas.Brush.Color := clWhite;
    LGrid.Canvas.Brush.Style := bsSolid;
    LGrid.Canvas.Pen.Style := psClear;
    LGrid.Canvas.FillRect(LRect);
    Inc(LRect.Left);
    LImageIndex := Trunc(LRating) * 2;
if Frac(LRating) >= 0.5 then
      Inc(LImageIndex);
    ImageList1.Draw(LGrid.Canvas, LRect.CenterPoint.X -
      (ImageList1.Width div 2), LRect.CenterPoint.Y - (ImageList1.Height div 2),
      LImageIndex);
end;

end;
- That's all folks! Press F9 (or go to
Run|Run), and we now have a nicer grid with more direct information about our data:
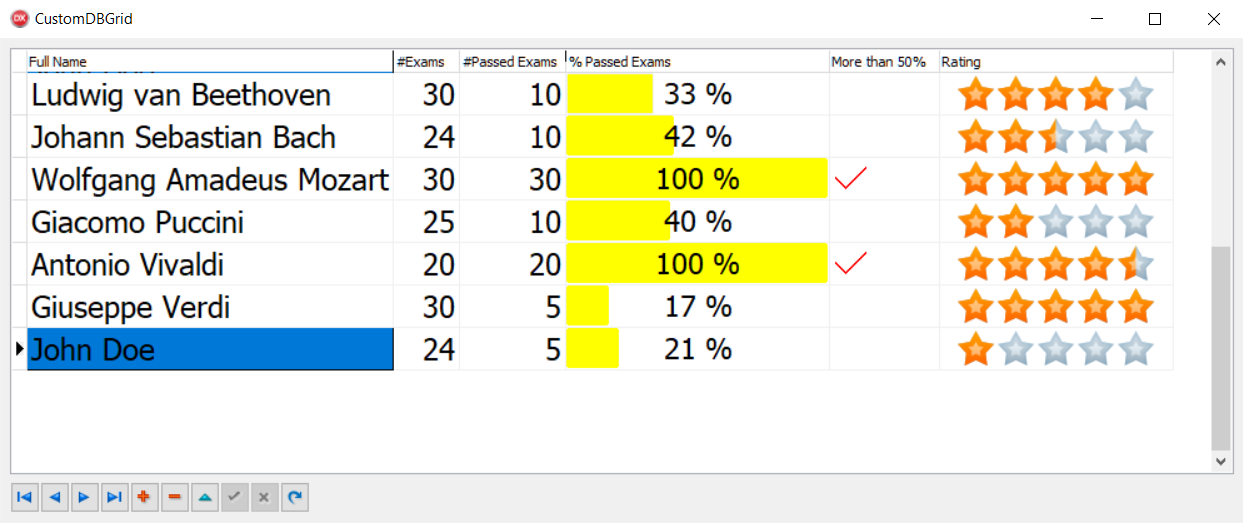
Figure 1.6: The same grid with a bit of customization
How it works...
By setting the TDBGrid property Default Drawing to False, we told the grid that we wanted to manually draw all the data into every cell. OnDrawColumnCell allows us to actually draw using standard Delphi code. For each cell we are about to draw, the event handler was called with a list of useful parameters to know which cell we're about to draw and what data we have to read, considering the column we are currently drawing. In this case, we want to draw only the calculated columns and the Rating field in a custom way. This is not a rule, but this can be done to manipulate all cells. We can draw any cell in the way we like. For the cells where we don't want to do custom drawing, a simple call method, DefaultDrawColumnCell, passes the same parameters we got from the event and the VCL code will draw the current cell as usual.
Among the event parameters, there is a Rect object (of type TRect) that represents the specific area we're about to draw. There is a column object (of type TColumn), which is a reference to the current column of the grid, and a State (of type TGridDrawState), which is a set of the grid cell states (for example, Selected, Focused, HotTrack, and many more). If our drawing code ignores the State parameter, all the cells will be drawn in the same way, and users cannot see which cell or row is selected.
The event handler uses a Pascal Sets Intersect to know whether the current cell should be drawn as a Selected or Focused cell. Refer to the following code for better clarity:
  if [gdSelected, gdFocused] * State <> [] then
    Grid.Canvas.Brush.Color := clHighlight;
Note
Remember that if your dataset has 100 records and 20 fields, OnDrawColumnCell will potentially be called 2,000 times! So, the event code must be fast; otherwise, the application will become less responsive.
There's more...
Owner drawing is a really large topic and can be simple or tremendously complex, involving much Canvas-related code. However, often, the kind of drawing you need will be relatively similar. So, if you need checks, arrows, color gradients, and so on, check the procedures into the Vcl.GraphUtil unit. Otherwise, if you need images, you could use TImageList to hold all the images needed by your grid, as we did in this recipe for the Rating field.
The good news is that the drawing code can be reused by different kinds of controls, so try to organize your code in a way that allows code reutilization by avoiding direct dependencies to the form where the control is.
The code in the drawing events should not contain business logic or presentation logic. If you need presentation logic, put it in a separate, testable function or class.