Monitoring Ceph clusters with Ceph Metrics with the Grafana dashboard
In this recipe, you will see how to monitor a Ceph cluster with the help of Ceph Metrics with the Grafana dashboard. The dashboard has information about the major Ceph daemons and their performances.
How to do it ...
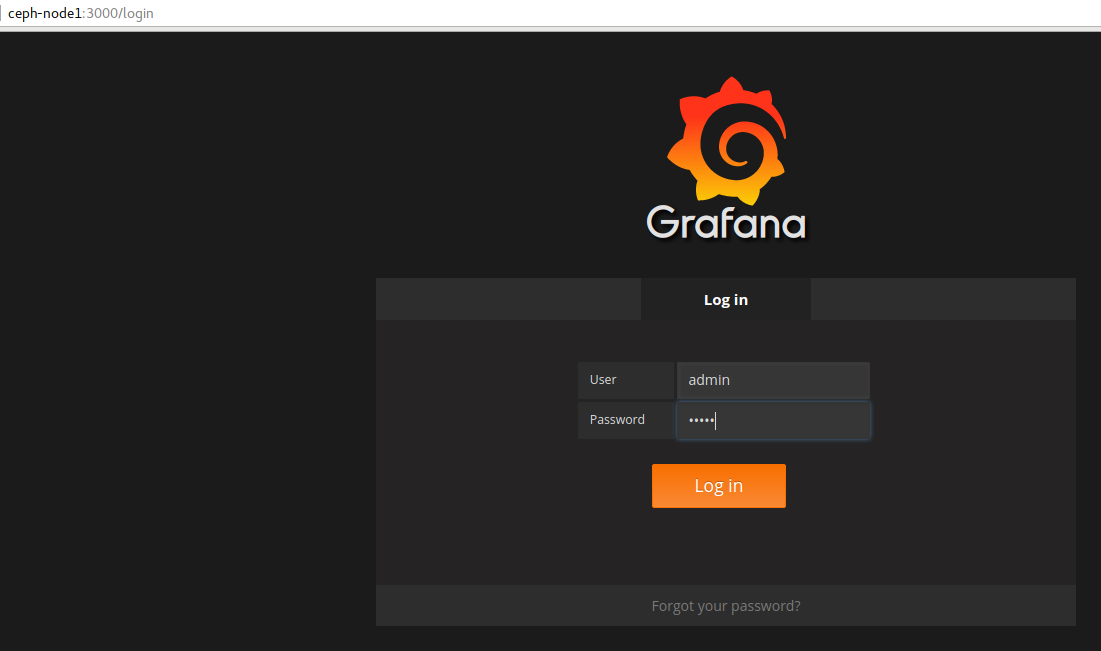
You should use the Grafana login page by using the link ceph-node1:3000/login and username and password as admin:
- Log in to the dashboard with the help of the given link and username/password:
- Once you log in, you will have the following dashboard:
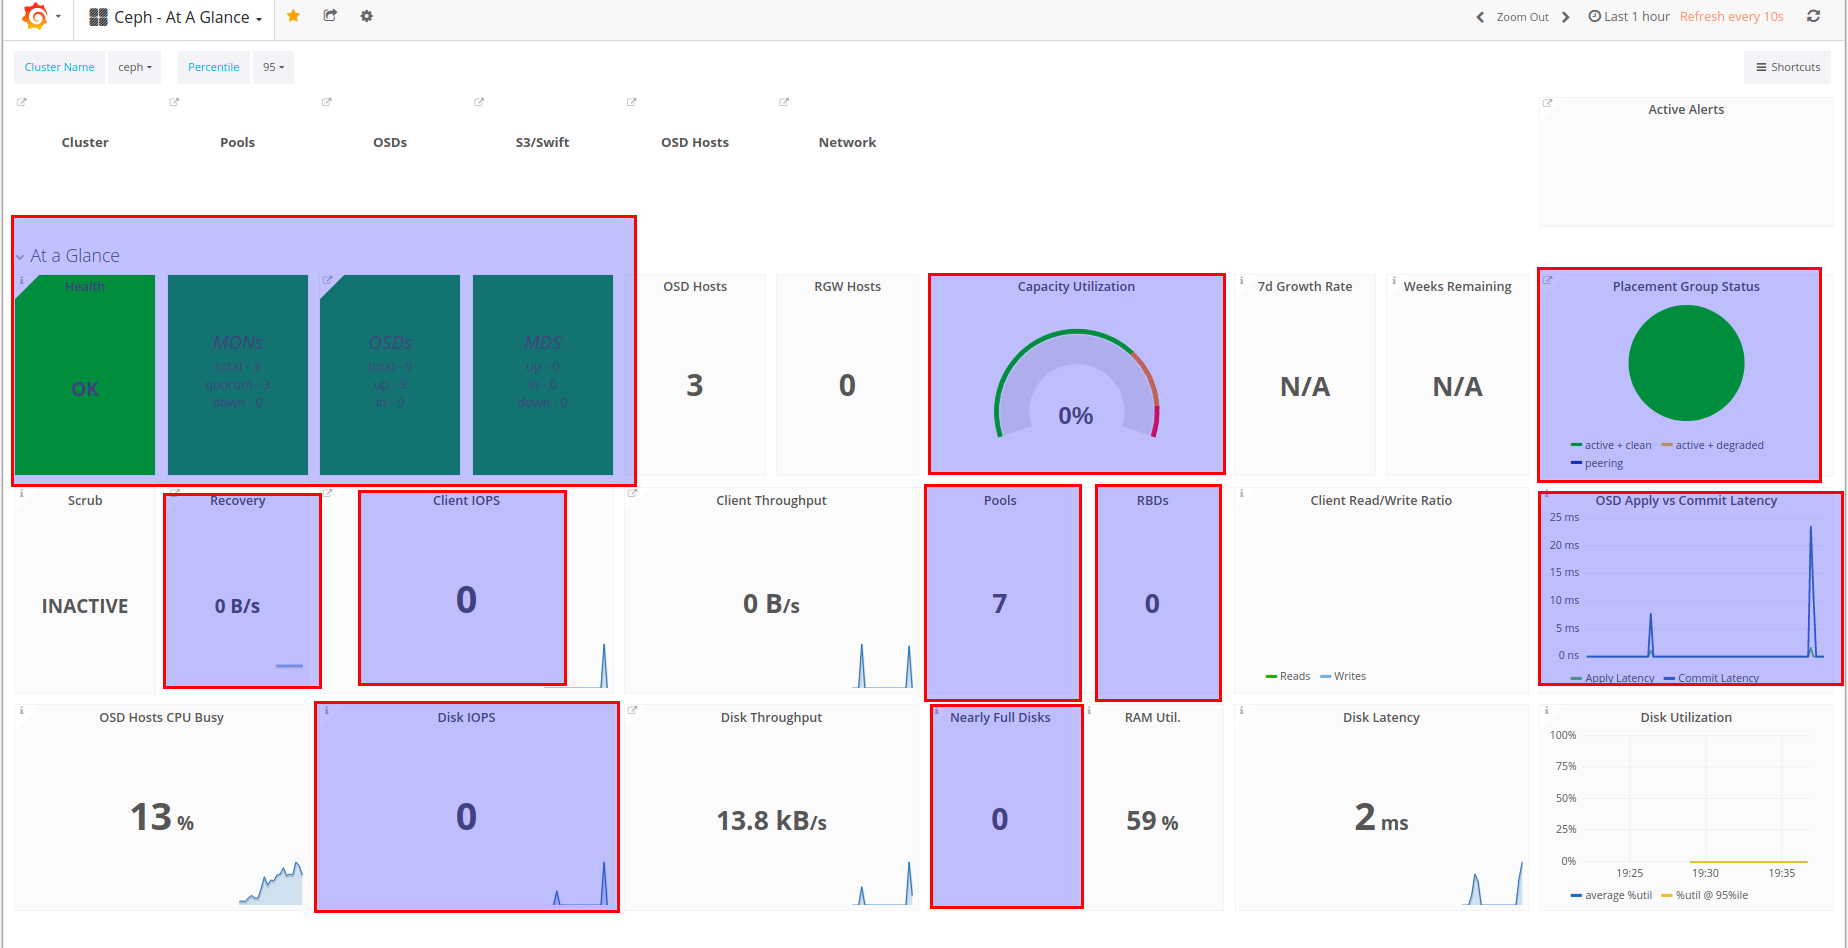
Ceph Metrics Dashboard
The first light green tab in the preceding dashboard screenshot is nothing but the cluster health which is HEALTH_OK and after that, the three dark green tabs are MON, OSD, and MDS and they are giving the total number of daemons:
- For MON, you can see we have three MONs and all three are in the quorum
- For OSD, you can see we have nine OSDs and all nine are up and in
- For MDS, we can see we do not have any MDS because we do not have a MDS daemon running...