Yesterday, the team at Lyft introduced a data discovery and metadata engine called Amundsen. Amundsen is introduced to increase the productivity of data scientists and research scientists at Lyft. The team named it Amundsen inspiring from the Norwegian explorer, Roald Amundsen. The aim is to improve the productivity of data users by making their lives simple with this data search interface.
According to UNECE (United Nations Economic Commission for Europe), the data in our world has grown over 40x spanning the last 10 years. The growth in data volumes has given rise to major challenges of productivity and compliance issues which were important to solve.
The team at Lyft found the solution to these problems in the metadata and not in the actual data. “Metadata, also defined as ‘data about the data’, is a set of data that describes and gives information about other data.” The team solved a part of the productivity problem using the metadata.
How did the team come up with Amundsen
The team at Lyft realized that the majority of their time was spent in data discovery instead of prototyping and productionalization, where they actually wanted to invest more time.
Data discovery involves answering questions like “If a certain type of data exists? Where is it? What is the source of truth of that data? Does it need to be accessed? And similar types of questions are answered in the process.
This the reason why the team at Lyft brought the idea of Amundsen inspired a lot by search engines like Google. But Amundsen is more of searching data in the organization. Users can search for data by typing in their search term in the search box. For instance, “election results” or “users”. For ones who aren’t aware of what they are searching for, the platform offers a list of popular tables in the organization to browse through them.
[caption id="attachment_26978" align="alignnone" width="696"]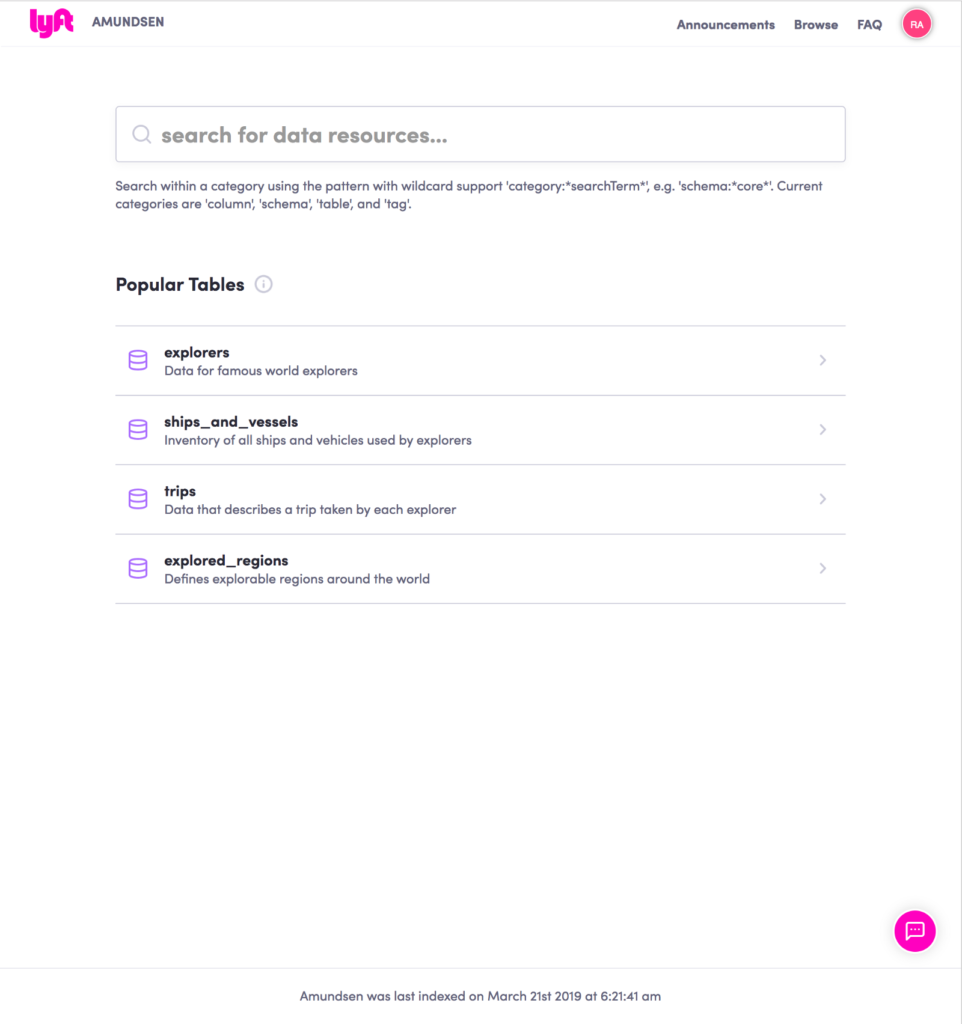 Image Source: Lyft[/caption]
How does the search ranking feature function
Once the user enters the search term, the results show in-line metadata and description of the table as well the last date when the table was updated. These results are chosen by fuzzy matching the entered text with a few metadata fields such as the table name, column name, table description and column descriptions. It uses an algorithm which is similar to Page Rank, where highly queried tables show up above, while those queried less are shown later in the search results.
How does the detail page look like
After selecting a result, users get to the detail page which shows the name of the table along with it’s manually curated description which is followed by the column list. A special blue arrow by a column indicates that it’s a popular column which encourages users to use it. On the right-hand pane, users can see who’s the owner, who are frequent users and a general profile of the data.
[caption id="attachment_26980" align="alignnone" width="696"]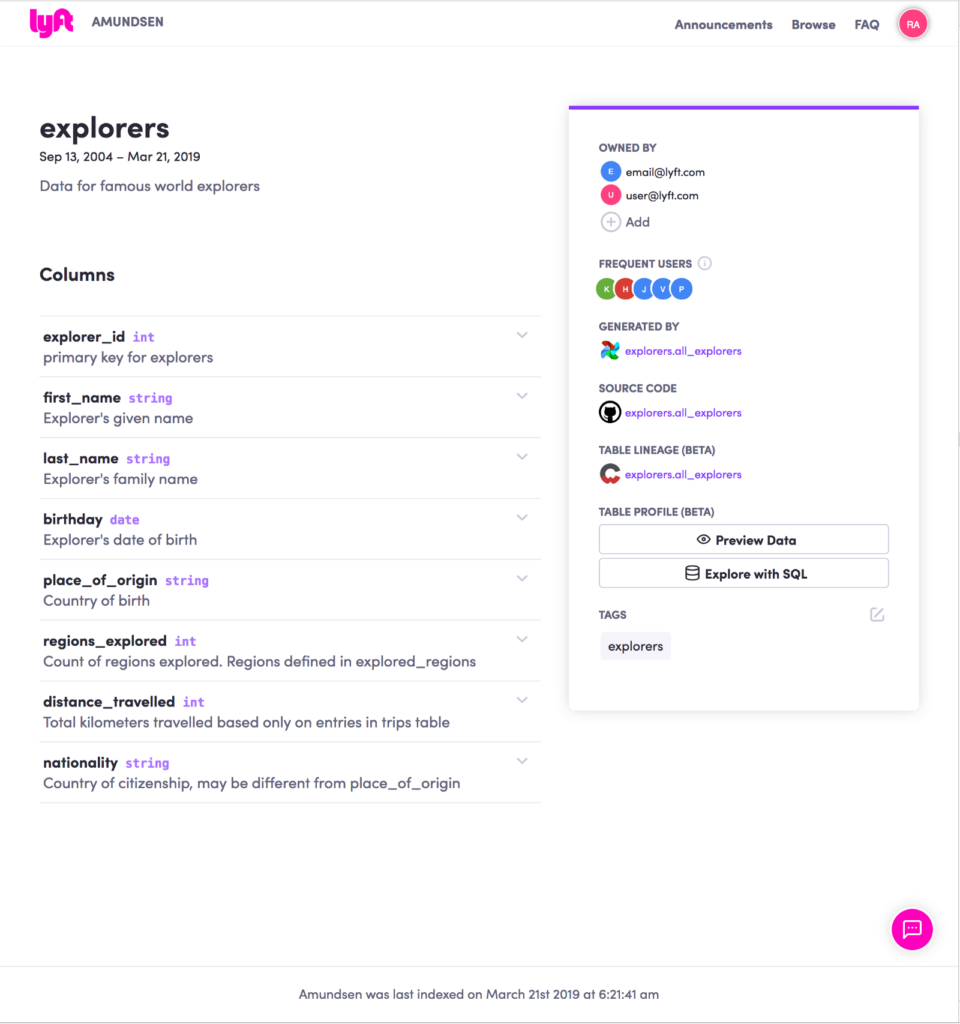 Image source: Lyft[/caption]
Further classification of metadata
The team Lyft divided the metadata into a few categories and gave different access to each of the categories.
Unlock access to the largest independent learning library in Tech for FREE!
Get unlimited access to 7500+ expert-authored eBooks and video courses covering every tech area you can think of.
Renews at £15.99/month. Cancel anytime
Existence and other fundamental metadata
This category includes name and description of table and fields, owners, last updated, etc. This metadata is available to everyone and anyone can access it.
Richer metadata
This category includes column stats and preview. This metadata is available to the users who have access to the data because these stats may have sensitive information which should be considered privileged.
According to the team at Lyft, Amundsen has been successful at Lyft and has shown a high adoption rate and Customer Satisfaction (CSAT) score. Users can now easily discover more data in a shorter time. Amundsen can also be used to store, and tag all personal data within the organization which can help an organization remain compliant.
To know more about this news, check out the official post by Lyft.
Lyft acquires computer vision startup Blue Vision Labs, in a bid to win the self driving car race
Uber and Lyft drivers strike in Los Angeles
Uber open-sources Peloton, a unified Resource Scheduler

 United States
 Great Britain
 India
India
 Germany
 France
 Canada
 Russia
 Spain
Spain
 Brazil
 Australia
 South Africa
 Thailand
 Ukraine
 Switzerland
 Slovakia
 Luxembourg
 Hungary
 Romania
 Denmark
 Ireland
 Estonia
 Belgium
 Italy
Italy
 Finland
 Cyprus
 Lithuania
 Latvia
 Malta
Malta
 Netherlands
 Portugal
 Slovenia
 Sweden
 Argentina
 Colombia
 Ecuador
 Indonesia
 Mexico
 New Zealand
 Norway
 South Korea
 Taiwan
 Turkey
 Czechia
 Austria
 Greece
 Isle of Man
 Bulgaria
 Japan
Japan
 Philippines
 Poland
 Singapore
 Egypt
Egypt
 Chile
Chile
 Malaysia