In this article by Gurmukh Singh, the author of the book Monitoring Hadoop, tells us the importance of monitoring Hadoop and its importance. It also explains various other concepts of Hadoop, such as its architecture, Ganglia (a tool used to monitor Hadoop), and so on.
(For more resources related to this topic, see here.)
In any enterprise, how big or small it could be, it is very important to monitor the health of all its components like servers, network devices, databases, and many more and make sure things are working as intended. Monitoring is a critical part for any business dependent upon infrastructure, by giving signals to enable necessary actions incase of any failures.
Monitoring can be very complex with many components and configurations in a real production environment. There might be different security zones; different ways in which servers are setup or a same database might be used in many different ways with servers listening on various service ports.
Before diving into setting up Monitoring and logging for Hadoop, it is very important to understand the basics of monitoring, how it works and some commonly used tools in the market. In Hadoop, we can do monitoring of the resources, services and also do metrics collection of various Hadoop counters.
There are many tools available in the market and one of them is Nagios, which is widely used. Nagios is a powerful monitoring system that provides you with instant awareness of your organization's mission-critical IT infrastructure.
By using Nagios, you can:
- Plan release cycle and rollouts, before things get outdated
- Early detection, before it causes an outage
- Have automation and a better response across the organization
Nagios Architecture
It is based on a simple server client architecture, in which the server has the capability to execute checks remotely using NRPE agents on the Linux clients. The results of execution are captured by the server and accordingly alerted by the system.

The checks could be for memory, disk, CPU utilization, network, database connection and many more. It provides the flexibility to use either active or passive checks.
Ganglia
Ganglia, it is a beautiful tool for aggregating the stats and plotting them nicely. Nagios, give the events and alerts, Ganglia aggregates and presents it in a meaningful way. What if you want to look for total CPU, memory per cluster of 2000 nodes or total free disk space on 1000 nodes.
Some of the key feature of Ganglia.
- View historical and real time metrics of a single node or for the entire cluster
- Use the data to make decision on cluster sizing and performance
Ganglia Components
- Ganglia Monitoring Daemon (gmond): This runs on the nodes that need to be monitored, captures state change and sends updates using XDR to a central daemon.
- Ganglia Meta Daemon (gmetad): This collects data from gmond and other gmetad daemons. The data is indexed and stored to disk in round robin fashion. There is also a Ganglia front-end for meaningful display of information collected.

All these tools can be integrated with Hadoop, to monitor it and capture its metrics.
Integration with Hadoop
There are many important components in Hadoop that needs to be monitored, like NameNode uptime, disk space, memory utilization, and heap size. Similarly, on DataNode we need to monitor disk usage, memory utilization or job execution flow status across the MapReduce components.
To know what to monitor, we must understand how Hadoop daemons communicate with each other.
There are lots of ports used in Hadoop, some are for internal communication like scheduling jobs, and replication, while others are for user interactions. They may be exposed using TCP or HTTP. Hadoop daemons provide information over HTTP about logs, stacks, metrics that could be used for troubleshooting. NameNode can expose information about the file system, live or dead nodes or block reports by the DataNode or JobTracker for tracking the running jobs.
Hadoop uses TCP, HTTP, IPC or socket for communication among the nodes or daemons.
Unlock access to the largest independent learning library in Tech for FREE!
Get unlimited access to 7500+ expert-authored eBooks and video courses covering every tech area you can think of.
Renews at £15.99/month. Cancel anytime

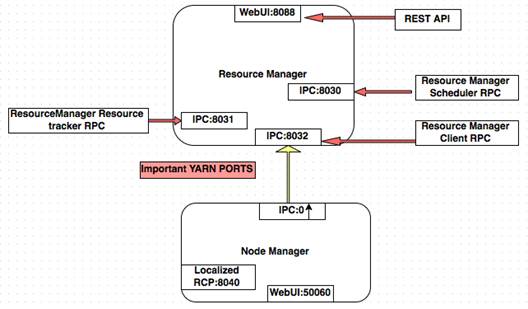
YARN Framework
The YARN (Yet Another resource Negotiator) is the new MapReduce framework. It is designed to scale for large clusters and performs much better as compared to the old framework. There are new sets of daemons in the new framework and it is good to understand how to communicate with each other. The diagram that follows, explains the daemons and ports on which they talk.
Logging in Hadoop
In Hadoop, each daemon writes its own logs and the severity of logging is configurable. The logs in Hadoop can be related to the daemons or the jobs submitted. Useful to troubleshoot slowness, issue with map reduce tasks, connectivity issues and platforms bugs. The logs generated can be user level like task tracker logs on each node or can be related to master daemons like NameNode and JobTracker.
In the newer YARN platform, there is a feature to move the logs to HDFS after the initial logging. In Hadoop 1.x the user log management is done using UserLogManager, which cleans and truncates logs according to retention and size parameters like mapred.userlog.retain.hours and mapreduce.cluster.map.userlog.retain-size respectively. The tasks standard out and error are piped to Unix tail program, so it retains the require size only.
The following are some of the challenges of log management in Hadoop:
- Excessive logging: The truncation of logs is not done till the tasks finish, this for many jobs could cause disk space issues as the amount of data written is quite large.
- Truncation: We cannot always say what to log and how much is good enough. For some users 500KB of logs might be good but for some 10MB might not suffice.
- Retention: How long to retain logs, 1 or 6 months?. There is no rule, but there are best practices or governance issues. In many countries there is regulation in place to keep data for 1 year. Best practice for any organization is to keep it for at least 6 months.
- Analysis: What if we want to look at historical data, how to aggregate logs onto a central system and do analyses. In Hadoop logs are served over HTTP for a single node by default.
Some of the above stated issues have been addressed in the YARN framework. Rather then truncating logs and that to on individual nodes, the logs can be moved to HDFS and processed using other tools. The logs are written at the per application level into directories per application. The user can access these logs through command line or web UI. For example, $HADOOP_YARN_HOME/bin/yarn logs.
Hadoop metrics
In Hadoop there are many daemons running like DataNode, NameNode, JobTracker, and so on, each of these daemons captures a lot of information about the components they work on. Similarly, in YARN framework we have ResourceManager, NodeManager, and Application Manager, each of which exposes metrics, explained in the following sections under Metrics2. For example, DataNode collects metrics like number of blocks it has for advertising to the NameNode, the number of replicated blocks, metrics about the various read or writes from clients. In addition to this there could be metrics related to events, and so on. Hence, it is very important to gather it for the working of the Hadoop cluster and also helps in debugging, if something goes wrong.
For this, Hadoop has a metrics system, for collecting all this information. There are two versions of the metrics system, Metrics and Metrics2 for Hadoop 1.x and Hadoop 2.x respectively. The file hadoop-metrics.properties and hadoop-metrics2.properties for each Hadoop version can be configured respectively.
Configuring Metrics2
For Hadoop version 2, which uses YARN framework, the metrics can be configured using hadoop-metrics2.properties, under the $HADOOP_HOME directory.
*.sink.file.class=org.apache.hadoop.metrics2.sink.FileSink
*.period=10
namenode.sink.file.filename=namenode-metrics.out
datanode.sink.file.filename=datanode-metrics.out
jobtracker.sink.file.filename=jobtracker-metrics.out
tasktracker.sink.file.filename=tasktracker-metrics.out
maptask.sink.file.filename=maptask-metrics.out
reducetask.sink.file.filename=reducetask-metrics.out
Hadoop metrics Configuration for Ganglia
Firstly, we need to define a sink class, as per Ganglia.
*.sink.ganglia.class=org.apache.hadoop.metrics2.sink.ganglia.GangliaSink31
Secondly, we need to define the frequency of how often the source showed be polled for data.
We are polling every 30 seconds:
*.sink.ganglia.period=30
Define retention for the metrics:
*.sink.ganglia.dmax=jvm.metrics.threadsBlocked=70,jvm.metrics.memHeapUsedM=40
Summary
In this article, we learned about Hadoop monitoring and its importance, and also the various concepts of Hadoop.
Resources for Article:
Further resources on this subject:

 United States
 Great Britain
 India
India
 Germany
 France
 Canada
 Russia
 Spain
Spain
 Brazil
 Australia
 South Africa
 Thailand
 Ukraine
 Switzerland
 Slovakia
 Luxembourg
 Hungary
 Romania
 Denmark
 Ireland
 Estonia
 Belgium
 Italy
Italy
 Finland
 Cyprus
 Lithuania
 Latvia
 Malta
Malta
 Netherlands
 Portugal
 Slovenia
 Sweden
 Argentina
 Colombia
 Ecuador
 Indonesia
 Mexico
 New Zealand
 Norway
 South Korea
 Taiwan
 Turkey
 Czechia
 Austria
 Greece
 Isle of Man
 Bulgaria
 Japan
Japan
 Philippines
 Poland
 Singapore
 Egypt
Egypt
 Chile
Chile
 Malaysia