In this article by Eric Pimpler, the author of the book Spatial Analytics with ArcGIS, you will be introduced to the use of spatial statistics tool available in ArcGIS to solve complex geographic analysis.
Obtaining basic spatial statistics about a dataset is often the first step in the analysis of geographic data. The Measuring Geographic Distributions toolset in the ArcGIS Spatial Statistics Tools toolbox contains a tool that provides descriptive geographic statistics such as the Central Feature tool.
In this article, you will learn how to use the central feature tool to obtain basic spatial statistical information about a dataset including the following topics:
- Preparing for geographic analysis
- Measuring geographic centrality with the central feature tool
(For more resources related to this topic, see here.)
Measuring geographic centrality
The Central Feature tool in the Measuring Geographic Distributions toolset can all be used to measure the geographic centrality of spatial data. In this exercise, the central feature tool will be used to obtain descriptive spatial statistics about crime data for the city of Denver.
Preparation
Let's get prepared for the geographic analysis by performing the following steps:
- In ArcMap, open the C:GeospatialTrainingSpatialStatsDenverCrime.mxd file. You should see a point feature class called Crime, as shown in the following screenshot:

- The Crime feature class contains point locations for all crimes for the city of Denver in 2013. The first thing we need to do is isolate a type of crime for our analysis. Open the attribute table for the crime feature class.
- Use the Select by Attributes tool to select all records, where OFFENSE_CATEGORY_ID = 'burglary' as shown in the following screenshot. This will select 25,743 burglaries from the dataset. These are burglaries within the city limits of Denver in 2013:

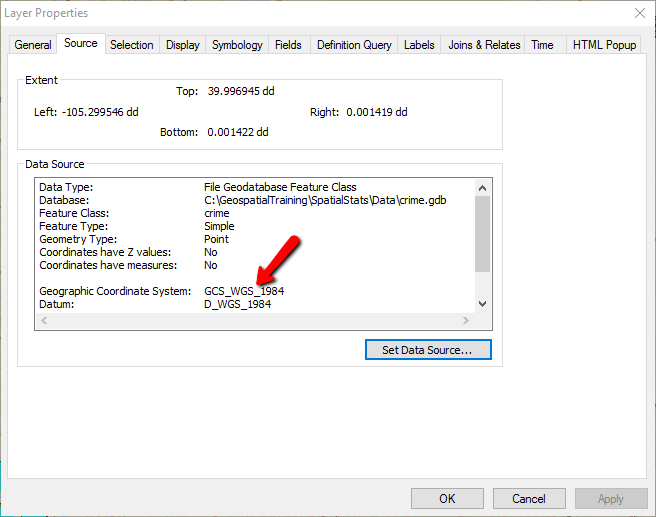
- Close the attribute table. In the Table of Contents block, right-click on the Crime layer and select Properties. Go to the Source tab and under Geographic Coordinate System note that the value is GCS_WGS_1984. Data is often stored in this WGS84 Web Mercator coordinate system for display purposes on the Web.
The WGS84 Web Mercator coordinate system that is so popular today for online mapping applications is not suitable for use with the Spatial Statistics tools. These tools require accurate distance measurements that aren't possible with WGS84 Web Mercator, so it's important to project your datasets to a coordinate system that supports accurate distance measurements.
Unlock access to the largest independent learning library in Tech for FREE!
Get unlimited access to 7500+ expert-authored eBooks and video courses covering every tech area you can think of.
Renews at €14.99/month. Cancel anytime
- Close this dialog by clicking on the Cancel button. Now, right-click on the Layers data frame and select Properties… and then Coordinate System. The current coordinate system of the data frame should be set to NAD_1983_UTM_Zone_13N, which is acceptable for our analysis.
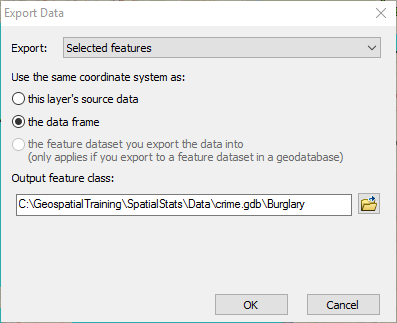
- With the records from the crime layer still selected, right-click on the Layers and go to Data | Export Data. The next dialog is very important. Select the the data frame option as the coordinate system, as shown in the following screenshot. Name the layer Burglary and export it to the crime geodatabase in C:GeospatialTrainingSpatialStatsExercisesDatacrime.gdb and then click on OK.
- The new Burglary layer will be added to the Layers data frame. Rename the layer to Denver Burglary.
- You can now remove the Crime layer.
- Save your map document file.
Run the Central Feature tool
The Central Feature tool identifies the most centrally located feature from a point, line, or polygon feature class. It adds and sums the distances from each feature to every other feature. The one with the shortest distance is the central feature.
This tool creates an output feature class containing a single feature that represents the most centrally located feature. For example, if you have a feature class of burglaries, the Central Feature tool will identify the crime location that is the central most location from the group and create a new feature class with a single point feature that represents this location:
- If necessary, open ArcToolbox and find the Spatial Statistics Tools toolbox. Open the toolbox and expand the Measuring Geographic Distributions toolset. Double-click on Central Feature to display the tool as shown in the following screenshot:

- Select Denver Burglary as the Input Feature Class, C:GeospatialTrainingSpatialStatsDatacrime.gdbBurglary_CentralFeature as the Output Feature Class, and EUCLIDEAN_DISTANCE as the Distance Method. Euclidean distance is a straight-line distance between two points. The other distance method is Manhattan distance, which is the distance between two points, measured along axes at right angles and is calculated by summing the difference between the x and y coordinates.
- There are the following three optional parameters for the Central Feature tool, including Weight Field(optional), Self Potential Weight Field(optional), and Case Field(optional). We won't use any of these optional parameters for this analysis, but they do warrant an explanation:
- Weight Field(optional): This parameter is a numeric field used to weigh distances in the origin-destination matrix. For example, if you had a dataset containing real-estate sales information each point might contain a sales price. The sales price could be used to weigh the output of the Central Feature tool.
- Self Potential Weight Field: This is a field representing self-potential or the distance or weight between a feature and itself.
- Case Field(optional): This parameter is a field used to group feature for separate central feature computations. This field can be an integer, data, or string.
- Click on the OK button.
- The most centrally located burglary will be displayed as shown in the following screenshot. The output is a single point feature:

Summary
This article covered the use of a descriptive spatial statistics tool, Central Feature tool found in the Measuring Geographic Distributions toolset. This central feature tool returns basic spatial statistical information about a dataset.
Resources for Article:
Further resources on this subject:

 United States
 Great Britain
 India
India
 Germany
 France
 Canada
 Russia
 Spain
Spain
 Brazil
 Australia
 South Africa
 Thailand
 Ukraine
 Switzerland
 Slovakia
 Luxembourg
 Hungary
 Romania
 Denmark
 Ireland
 Estonia
 Belgium
 Italy
Italy
 Finland
 Cyprus
 Lithuania
 Latvia
 Malta
Malta
 Netherlands
 Portugal
 Slovenia
 Sweden
 Argentina
 Colombia
 Ecuador
 Indonesia
 Mexico
 New Zealand
 Norway
 South Korea
 Taiwan
 Turkey
 Czechia
 Austria
 Greece
 Isle of Man
 Bulgaria
 Japan
Japan
 Philippines
 Poland
 Singapore
 Egypt
Egypt
 Chile
Chile
 Malaysia