In this article by Robert C. Cain, coauthor of the book SQL Server 2016 Reporting Services Cookbook, we’ll take a brief tour of the new features in SQL Server 2016 Reporting Services.
SQL Server 2016 Reporting Services is a true evolution in reporting technology. After making few changes to SSRS over the last several releases, Microsoft unveiled a virtual cornucopia of new features.
(For more resources related to this topic, see here.)
Report Portal
The old Report Manager has received a complete facelift, along with many added new features. Along with it came a rename, it is now known as the Report Portal. The following is a screenshot of the new portal:

KPIs
KPIs are the first feature you’ll notice. The Report Portal has the ability to display key performance indicators directly, meaning your users can get important metrics at a glance, without the need to open reports. In addition, these KPIs can be linked to other report items such as reports and dashboards, so that a user can simply click on them to find more information.
Mobile Reporting
Microsoft recognized the users in your organization no longer use just a computer to retrieve their information. Mobile devices, such as phones and tablets, are now commonplace. You could, of course, design individual reports for each platform, but that would cause a lot of repetitive work and limit reuse.
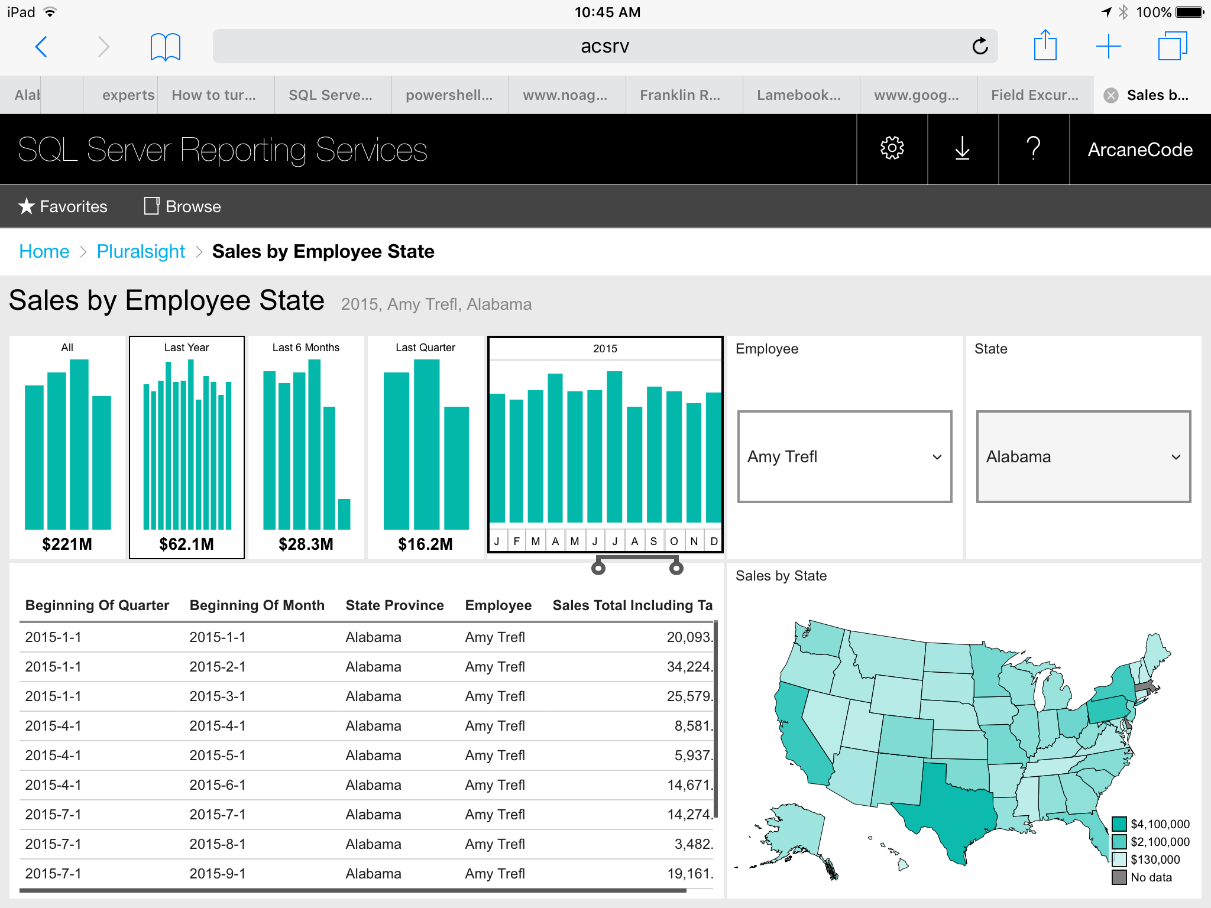
To solve this, Microsoft has incorporated a new tool, Mobile Reports. This allows you to create an attractive dashboard that can be displayed in any web browser. In addition, you can easily rearrange the dashboard layout to optimize for both phones and tablets. This means you can create your report once, and use it on multiple platforms.
Below are three images of the same mobile report. The first was done via a web browser, the second on a tablet, and the final one on a phone:

Unlock access to the largest independent learning library in Tech for FREE!
Get unlimited access to 7500+ expert-authored eBooks and video courses covering every tech area you can think of.
Renews at €14.99/month. Cancel anytime

Paginated reports
Traditional SSRS reports have now been renamed Paginated Reports, and are still a critical element in reporting. These provide the detailed information needed for day to day activities in your company.
Paginated reports have received several enhancements. First, there are two new chart types, Sunburst and TreeMap. Reports may now be exported to a new format, PowerPoint. Additionally, all reports are now rendered in HTML 5 format. This makes them accessible to any browser, including those running on tablets or other platforms such as Linux or the Mac.
PowerBI
PowerBI Desktop reports may now be housed within the Report Portal. Currently, opening one will launch the PowerBI desktop application.However, Microsoft has announced in an upcoming update to SSRS 2016 PowerBI reports will be displayed directly within the Report Portal without the need to open the external app.
Reporting applications
Speaking of Apps, the Report Builder has received a facelift, updating it to a more modern user interface with a color scheme that matches the Report Portal. Report Builder has also been decoupled from the installation of SQL Server. In previous versions Report Builder was part of the SQL Server install, or it was available as a separate download.
With SQL Server 2016, both the Report Builder and the Mobile Reporting tool are separate downloads making them easier to stay current as new versions are released. The Report Portal now contains links to download these tools.
Excel
Excel workbooks, often used as a reporting tool itself, may now be housed within the Report Portal. Opening them will launch Excel, similar to the way in which PowerBI reports currently work.
Summary
This article summarizes just some of the many new enhancements to SQL Server 2016 Reporting Services. With this release, Microsoft has worked toward meeting the needs of many users in the corporate environment, including the need for mobile reporting, dashboards, and enhanced paginated reports.
For more details about these and many more features see the book SQL Server 2016 Reporting Services Cookbook, by Dinesh Priyankara and Robert C. Cain.
Resources for Article:
Further resources on this subject:

 United States
 Great Britain
 India
India
 Germany
 France
 Canada
 Russia
 Spain
Spain
 Brazil
 Australia
 South Africa
 Thailand
 Ukraine
 Switzerland
 Slovakia
 Luxembourg
 Hungary
 Romania
 Denmark
 Ireland
 Estonia
 Belgium
 Italy
Italy
 Finland
 Cyprus
 Lithuania
 Latvia
 Malta
Malta
 Netherlands
 Portugal
 Slovenia
 Sweden
 Argentina
 Colombia
 Ecuador
 Indonesia
 Mexico
 New Zealand
 Norway
 South Korea
 Taiwan
 Turkey
 Czechia
 Austria
 Greece
 Isle of Man
 Bulgaria
 Japan
Japan
 Philippines
 Poland
 Singapore
 Egypt
Egypt
 Chile
Chile
 Malaysia


